
Incidents bring together higher-order issues across your environment, such as a room outage or a wider environment outage, that may not be obvious from any single alert. The Incidents tab of the Hotlist groups incidents by lifecycle state and surfaces priority and assignment at a glance. Authorised users can create, edit, resolve, and associate alerts with incidents directly from here.
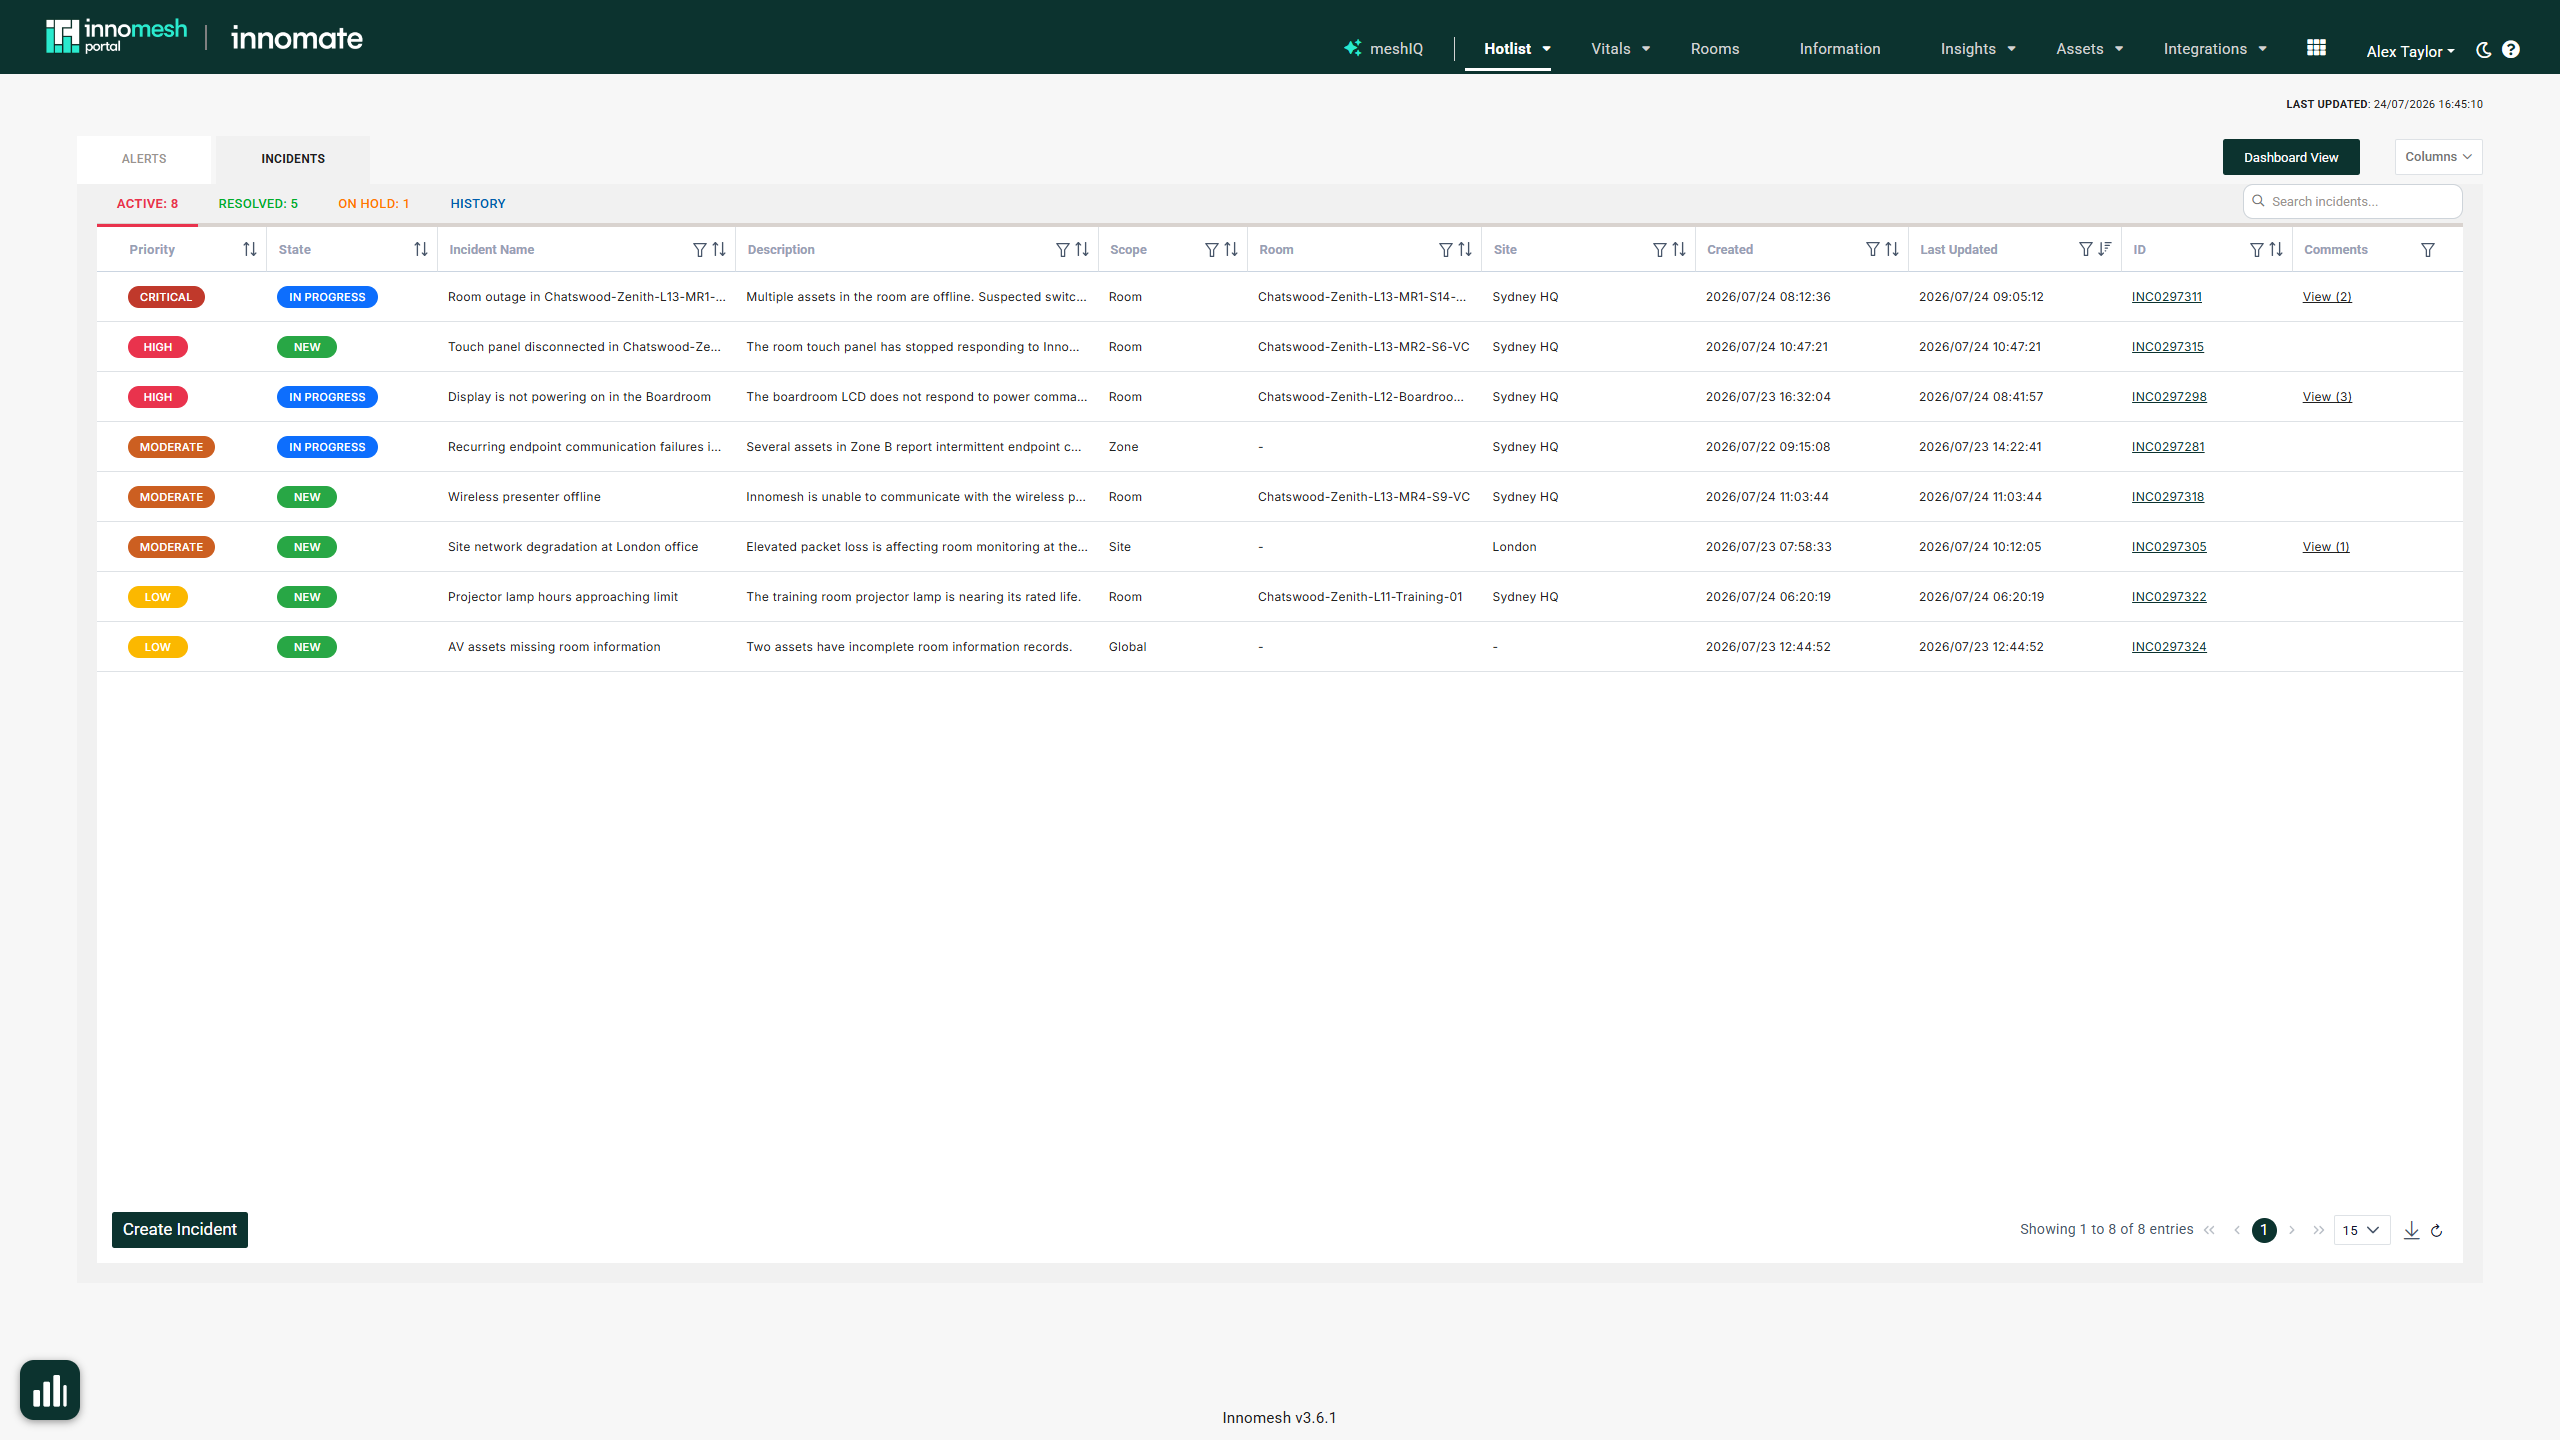 Incidents tab | Innomesh Portal
How Incidents Work
An incident groups one or more related alerts into a single trackable issue: for example, several alerts of the same type, or multiple alerts within one room. Incidents are raised in two ways:
- Automatically, when an Incident Rule you have defined matches the current alert conditions.
- Manually, using the Create Incident dialog, so your team can surface and track issues that Innomesh has not detected automatically.
Each incident carries a scope of Global, Site, Zone, or Room, which determines the alerts that can be associated with it. Its priority (Critical, High, Moderate, Low, or Planning) is derived from the incident’s Impact and Urgency.
State Sub-tabs
Four sub-tabs group incidents by state. Each label shows how many incidents match.
| Sub-tab | Contents |
|---|---|
| Active | Incidents in the New or In Progress state |
| Resolved | Incidents in the Resolved or Closed state |
| On Hold | Incidents in the On Hold state |
| History | A chronological log of incident status changes and other activity |
Table Columns
Active, Resolved, and On Hold share the same layout:
| Column | Description |
|---|---|
| Priority | Coloured badge: Critical, High, Moderate, Low, or Planning |
| State | Coloured badge matching the sub-tab |
| Incident Name | The incident’s name |
| Description | Free-form summary of the incident |
| Scope | Global, Room, Zone, or Site |
| Room | Populated when the scope is Room |
| Site | Associated site |
| Assigned To | Current owner |
| Created | When the incident was raised |
| Last Updated | When the incident last changed |
| ID | Incident identifier with a copy icon |
| Comments | View (n) when comments exist; hover to preview the most recent comments |
History swaps in Timestamp and Event columns for the audit trail.
Columns can be sorted, filtered, resized, and reordered, and Columns controls which are shown.
Searching and Clearing
Use Search incidents… at the top-right to filter across all text columns. Clear Search appears below the table while a filter is active, and Reset table appears once you have resized columns.
Creating an Incident
Click Create Incident on any sub-tab except History. See Creating an Incident for the full flow.
Opening an Incident
Click a row to open the Incident Detail View, which has Information, Associated Alerts, and Comments sections.
Incident Trends
Click the Incident Trends button in the bottom corner to open a graph of incident activity over time, giving you a quick read on whether your environment is trending better or worse.
Export
The download icon in the bottom-right exports the filtered rows to CSV.
Mobile
On mobile the table is replaced by a card list with pull-to-refresh. Each card opens the detail view via View Details.