

The Hotlist is the central alert dashboard in Innomesh Portal. It displays every active alert across your environment in real time, in a single unified list with the highest-severity alerts at the top. Use it to monitor, triage, and resolve device and infrastructure issues.
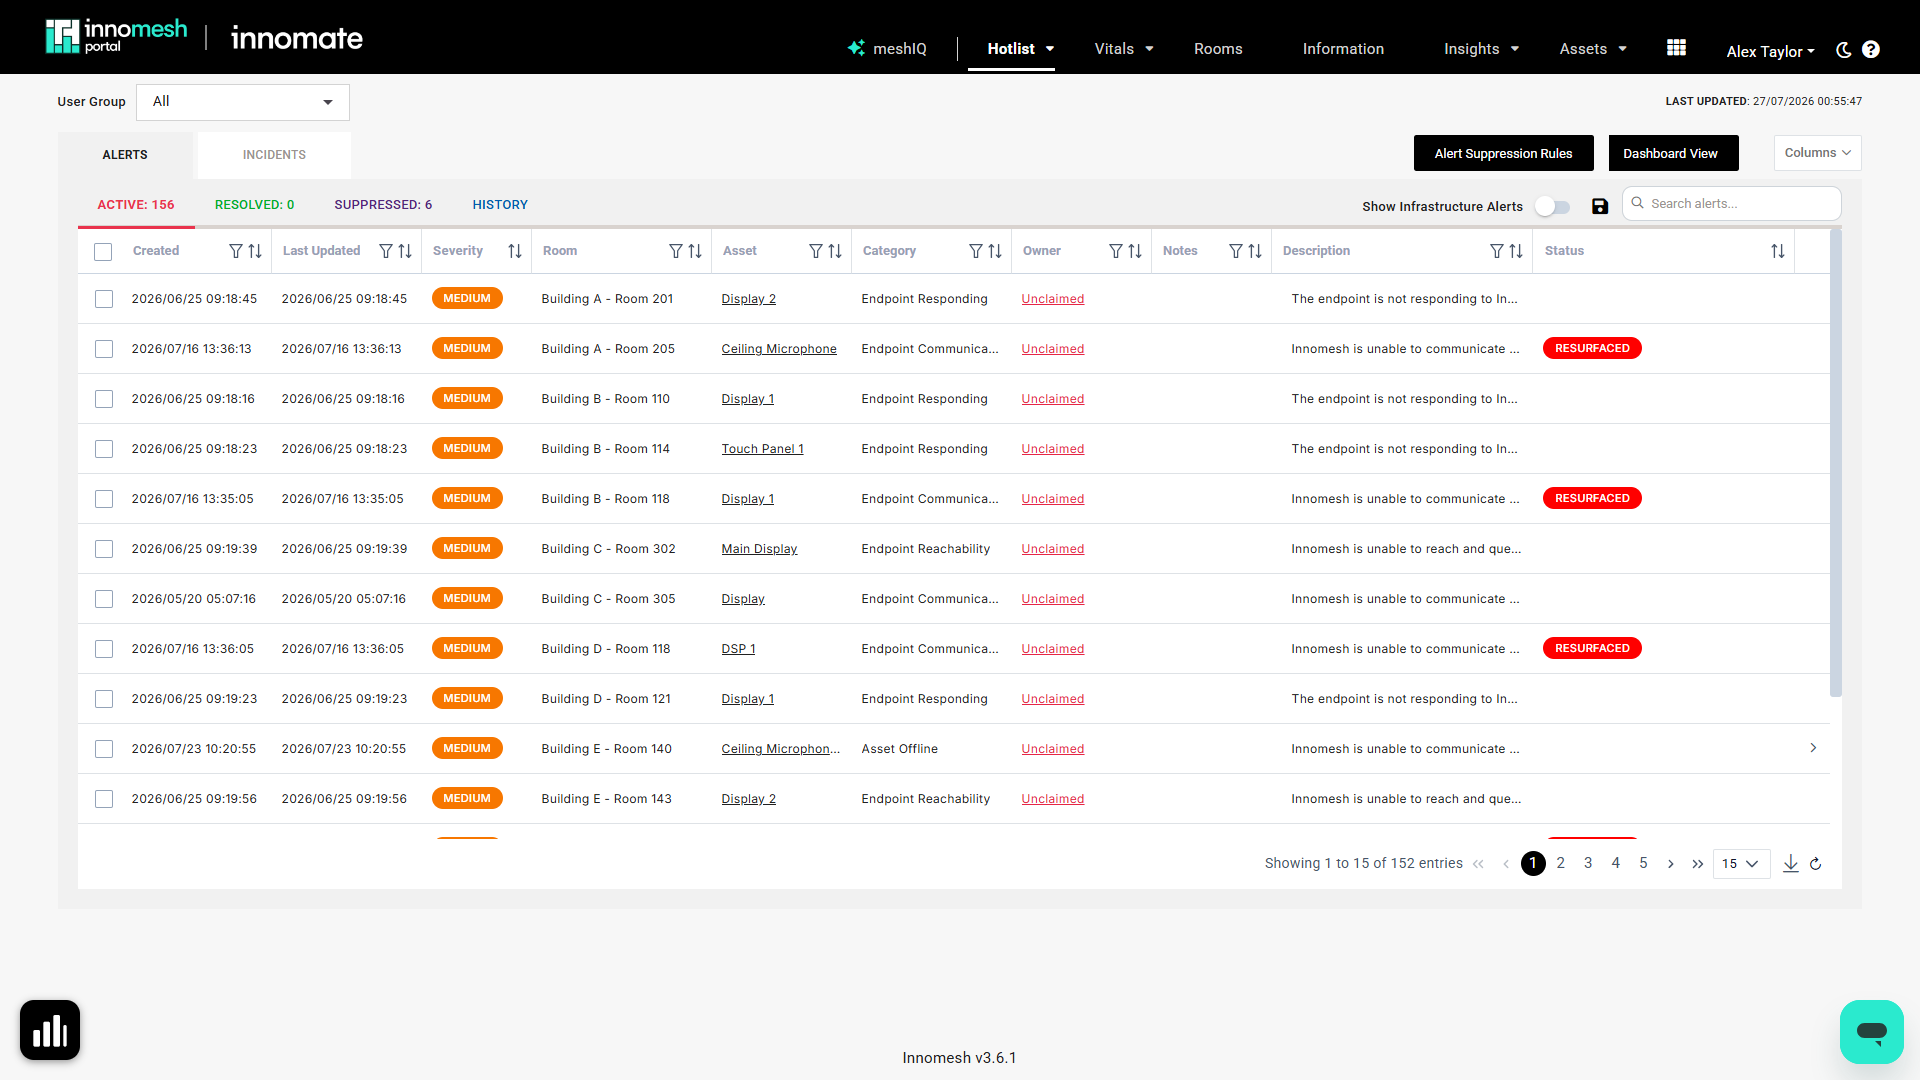 Hotlist overview | Innomesh Portal
Alerts and Incidents
The Hotlist has two tabs. Alerts shows individual alerts raised against rooms, assets, and infrastructure, and is the focus of this article. Incidents brings together higher-order issues across your environment, such as a room outage or a wider environment outage, that may not be obvious from any single alert.
Alert States
Four sub-tabs group alerts by state, each with a running count:
| State | Contents |
|---|---|
| Active | Alerts currently in effect, shown as a single list sorted by severity |
| Resolved | Previously active alerts that have cleared, held for review |
| Suppressed | Alerts intentionally hidden from the active view by suppression rules |
| History | A chronological record of past alert events |
Alert Severities
Each alert carries a severity level, shown as a coloured badge in the list. The highest-severity alerts always sort to the top.
| Severity | Description | Example |
|---|---|---|
| Critical | High-impact issues affecting infrastructure or multiple rooms | Host memory above 90%, licensing capacity exceeded |
| High | Issues rendering a single room non-functional | Room offline, gateway connection lost |
| Medium | Issues impairing room operations | Device memory above threshold, endpoint communication failure |
| Low | Informational notices or pending warnings | Projector lamp hours approaching limit, battery below 20% |
| Notice | Advisory items that may require future attention | Non-standard room name detected, missing room information |
The Unified Alert List
The Active list shows one row per alert. The default columns are Created, Last Updated, Severity, Room, Asset, Category, Owner, Description, and Status. The Last Updated column shows the most recent user action on the alert, for example when it was claimed or assigned. The Status column flags alerts that have resurfaced.
Click Columns to choose which columns are shown. Additional columns include Resolved, Room Friendly Name, Zone, Notes, Incident ID, and Diagnosis. Use the save icon next to the search box to keep your current filter and column layout as a saved view.
Infrastructure Alerts
Infrastructure alerts (typically owned by Innomate) are hidden by default, keeping the list focused on the rooms and assets your team supports. Toggle Show Infrastructure Alerts to include them whenever you need them.
Asset Offline Grouping
When an asset is unreachable across the different Innomesh technologies (Space, Sight, and Pulse), those alerts are grouped under a single Asset Offline alert. Expand the row to view the underlying alerts when required.
Alert Trends
Click the Alert Trends button in the bottom corner of the Hotlist to open a graph of alert activity over time, giving you a quick read on whether your environment is trending better or worse.
Alert Lifecycle
An alert progresses through several stages:
- Detection: The platform detects an alert condition (e.g., device goes offline)
- Grace Period: A 2-minute window before the alert appears in the Hotlist, to filter transient issues
- Active: The alert appears in the unified Hotlist list
- Resolution: The condition clears (automatic) or a user manually resolves the alert
- Resolved Hold: Resolved alerts remain visible for a minimum of 60 minutes before being cleared
- Resurfacing: If the same condition recurs within 60 minutes, the alert is tagged as “Resurfaced”
Key Features
Claiming an Alert
Claiming an alert signals to your team that someone is investigating. Click an alert to open the Alert Details panel, then click Claim. Your name appears as the owner.
Assigning Alerts
Assign alerts to specific users or groups. This is useful for routing issues to the appropriate support team.
Search and Filter
Use the search bar to find alerts by room name, device name, or description. Each column also has its own filter and sort controls. Filter by User Group using the dropdown at the top of the page, and by Site in multi-site tenancies.
Dashboard View
Click Dashboard View to switch to a summary view showing alert counts by severity. This is useful for at-a-glance monitoring on a wall-mounted display.
Mass Operations
Select multiple alerts to perform bulk actions:
- Mass Resolve: Clear multiple alerts at once
- Purge: Permanently delete resolved alerts (useful when rebuilding rooms)
Alert Details
Click any alert to open the details panel, which shows:
- Severity and category (e.g., Device Set Health, CPU, Memory)
- Room and device information
- Description of the alert condition
- Threshold value that triggered the alert
- History tab showing the full event timeline
- Notes added by support staff or the Innomate diagnosis team
- Ticket ID if a ServiceNow ticket has been created
Permanently Suppressed Alerts
Some alerts are permanently suppressed by the platform because their trigger conditions are expected and do not represent real issues. These alerts never appear in the Active Hotlist:
- XPanels: “Device not connected” alerts for XPanels. XPanels are designed to be launched and closed at any time, so a disconnected XPanel is not an error. These alerts are dropped entirely and do not appear in the Suppressed tab.
- In Maintenance: Room and device alerts where the room or device is flagged as “In Maintenance” in Innomesh.
- Portable: Room and device alerts where the room or device is flagged as “Portable” (typically mobile AV systems that may be disconnected when not in use).
- PDU Connected: “Device not connected/communicating” alerts where the device is flagged as “PDU Connected” and the room is currently powered off. These alerts are dropped entirely and do not appear in the Suppressed tab.
For user-defined suppression rules (room-level and device-level), see the Alert Suppression article. A comment explaining the reason is required when adding a manual suppression rule.