

The Sight dashboard provides real-time device state monitoring, surfacing expanded information about devices across all rooms. Open it from the Sight tab of the Vitals page.
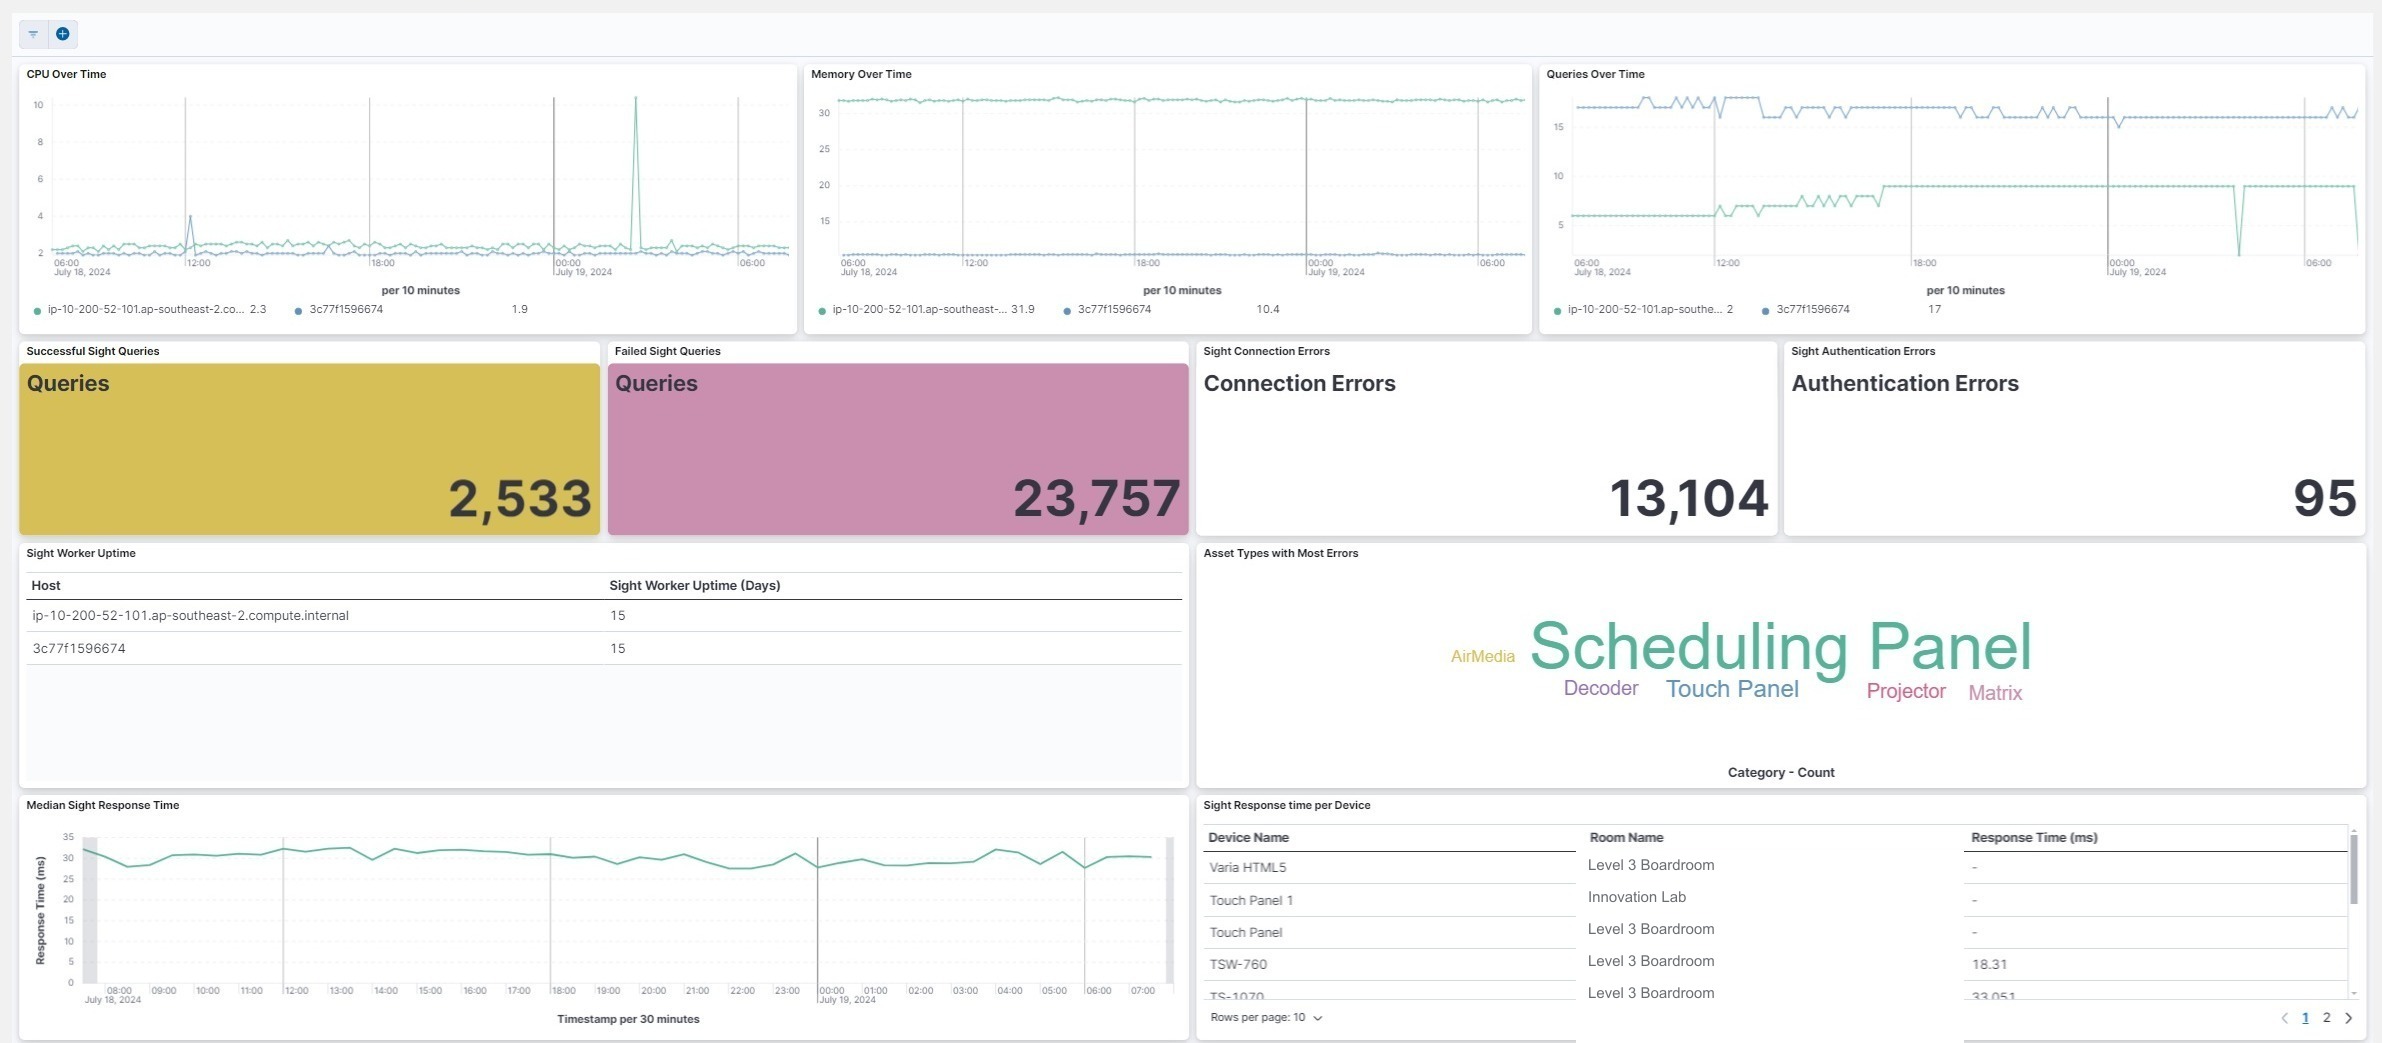
Sight monitors device state through several metrics:
- CPU Over Time shows CPU usage of the servers in use.
- Memory Over Time shows memory usage of the servers in use.
- Queries Over Time tracks information extracted from the database.
- Successful Sight Queries counts successful device pings.
- Failed Sight Queries counts unsuccessful device pings.
- Sight Connection Errors counts unreachable devices.
- Sight Authentication Errors counts Sight authentication failures.
- Sight Worker Uptime shows host uptime in days.
- Asset Types with Most Errors highlights the device types where most errors have been detected.
- Median Sight Response Time shows the average response time.
- Sight Response Time per Device shows the response time for reaching a specific device.