
meshIQ turns a plain-language question into an insight: a written summary alongside a chart. This article covers asking a question, reading the result, and saving insights you want to keep. For an introduction to meshIQ, see the meshIQ Overview.
Asking a Question
Type a question in plain language, or select one of the preset questions. When a question calls for data across your estate, meshIQ runs the query and returns a written summary alongside a chart.
In the example below, meshIQ answered “Show me the alert trend over the last two months” with a daily alert trend chart split by severity, drawn from the alerts_lifecycle dataset.
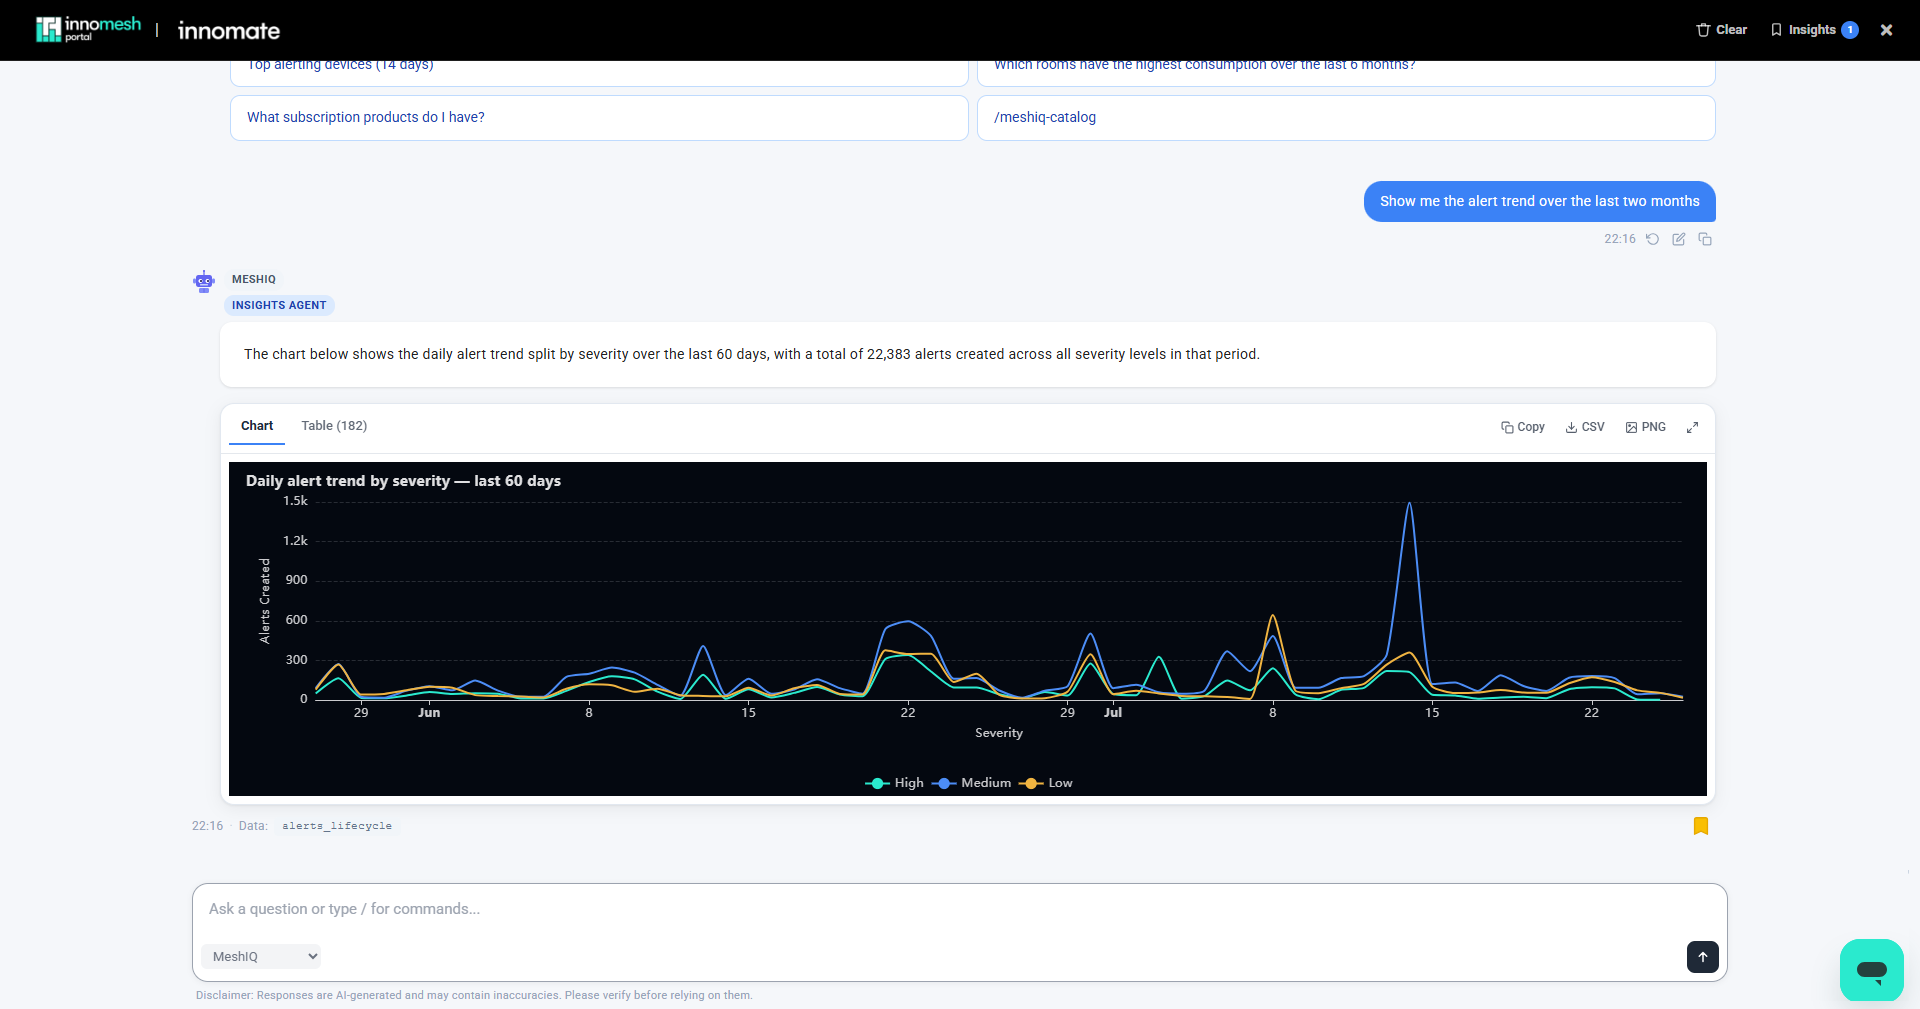
Each generated insight offers:
- Chart and Table tabs, so you can switch between the visualisation and the underlying data.
- Copy, CSV, and PNG controls to copy the table, download the data, or download the chart image, plus an Expand control to view the chart full-screen.
- A data source tag naming the dataset the answer was drawn from.
- A timezone pill naming the timezone the result’s times are in. See Chat Controls and Feedback.
Saving Insights
Every generated insight shows a bookmark icon. Selecting it saves the insight, where it can later be copied, downloaded as a CSV, or downloaded as a PNG.
The Saved Insights Page
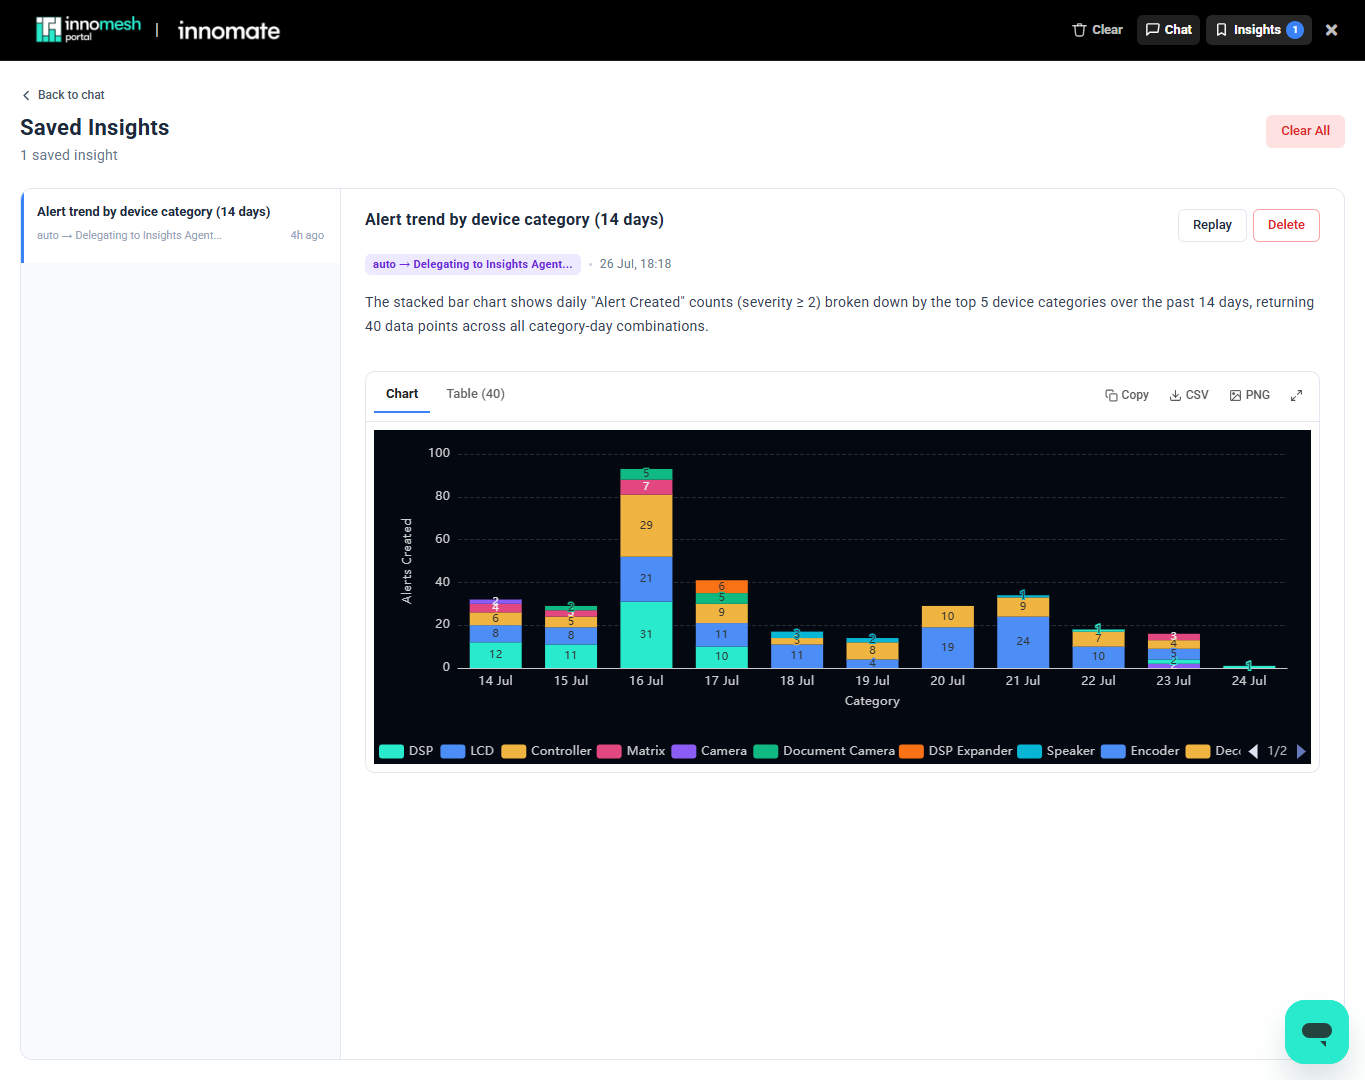
Bookmarked insights are collected on the Saved Insights page. Open it from the Insights button in the meshIQ header (the number beside it is your saved-insight count).
The page lists your saved insights down the left. Selecting one shows its summary and chart with the same Chart and Table tabs and Copy, CSV, and PNG controls as the original response. Each saved insight also offers:
- Replay to re-run the query and refresh the result.
- Delete to remove the saved insight, or Clear All to remove every saved insight.