

The Infrastructure dashboard monitors server performance across your Innomesh environment. Open it from the Infrastructure tab of the Vitals page.
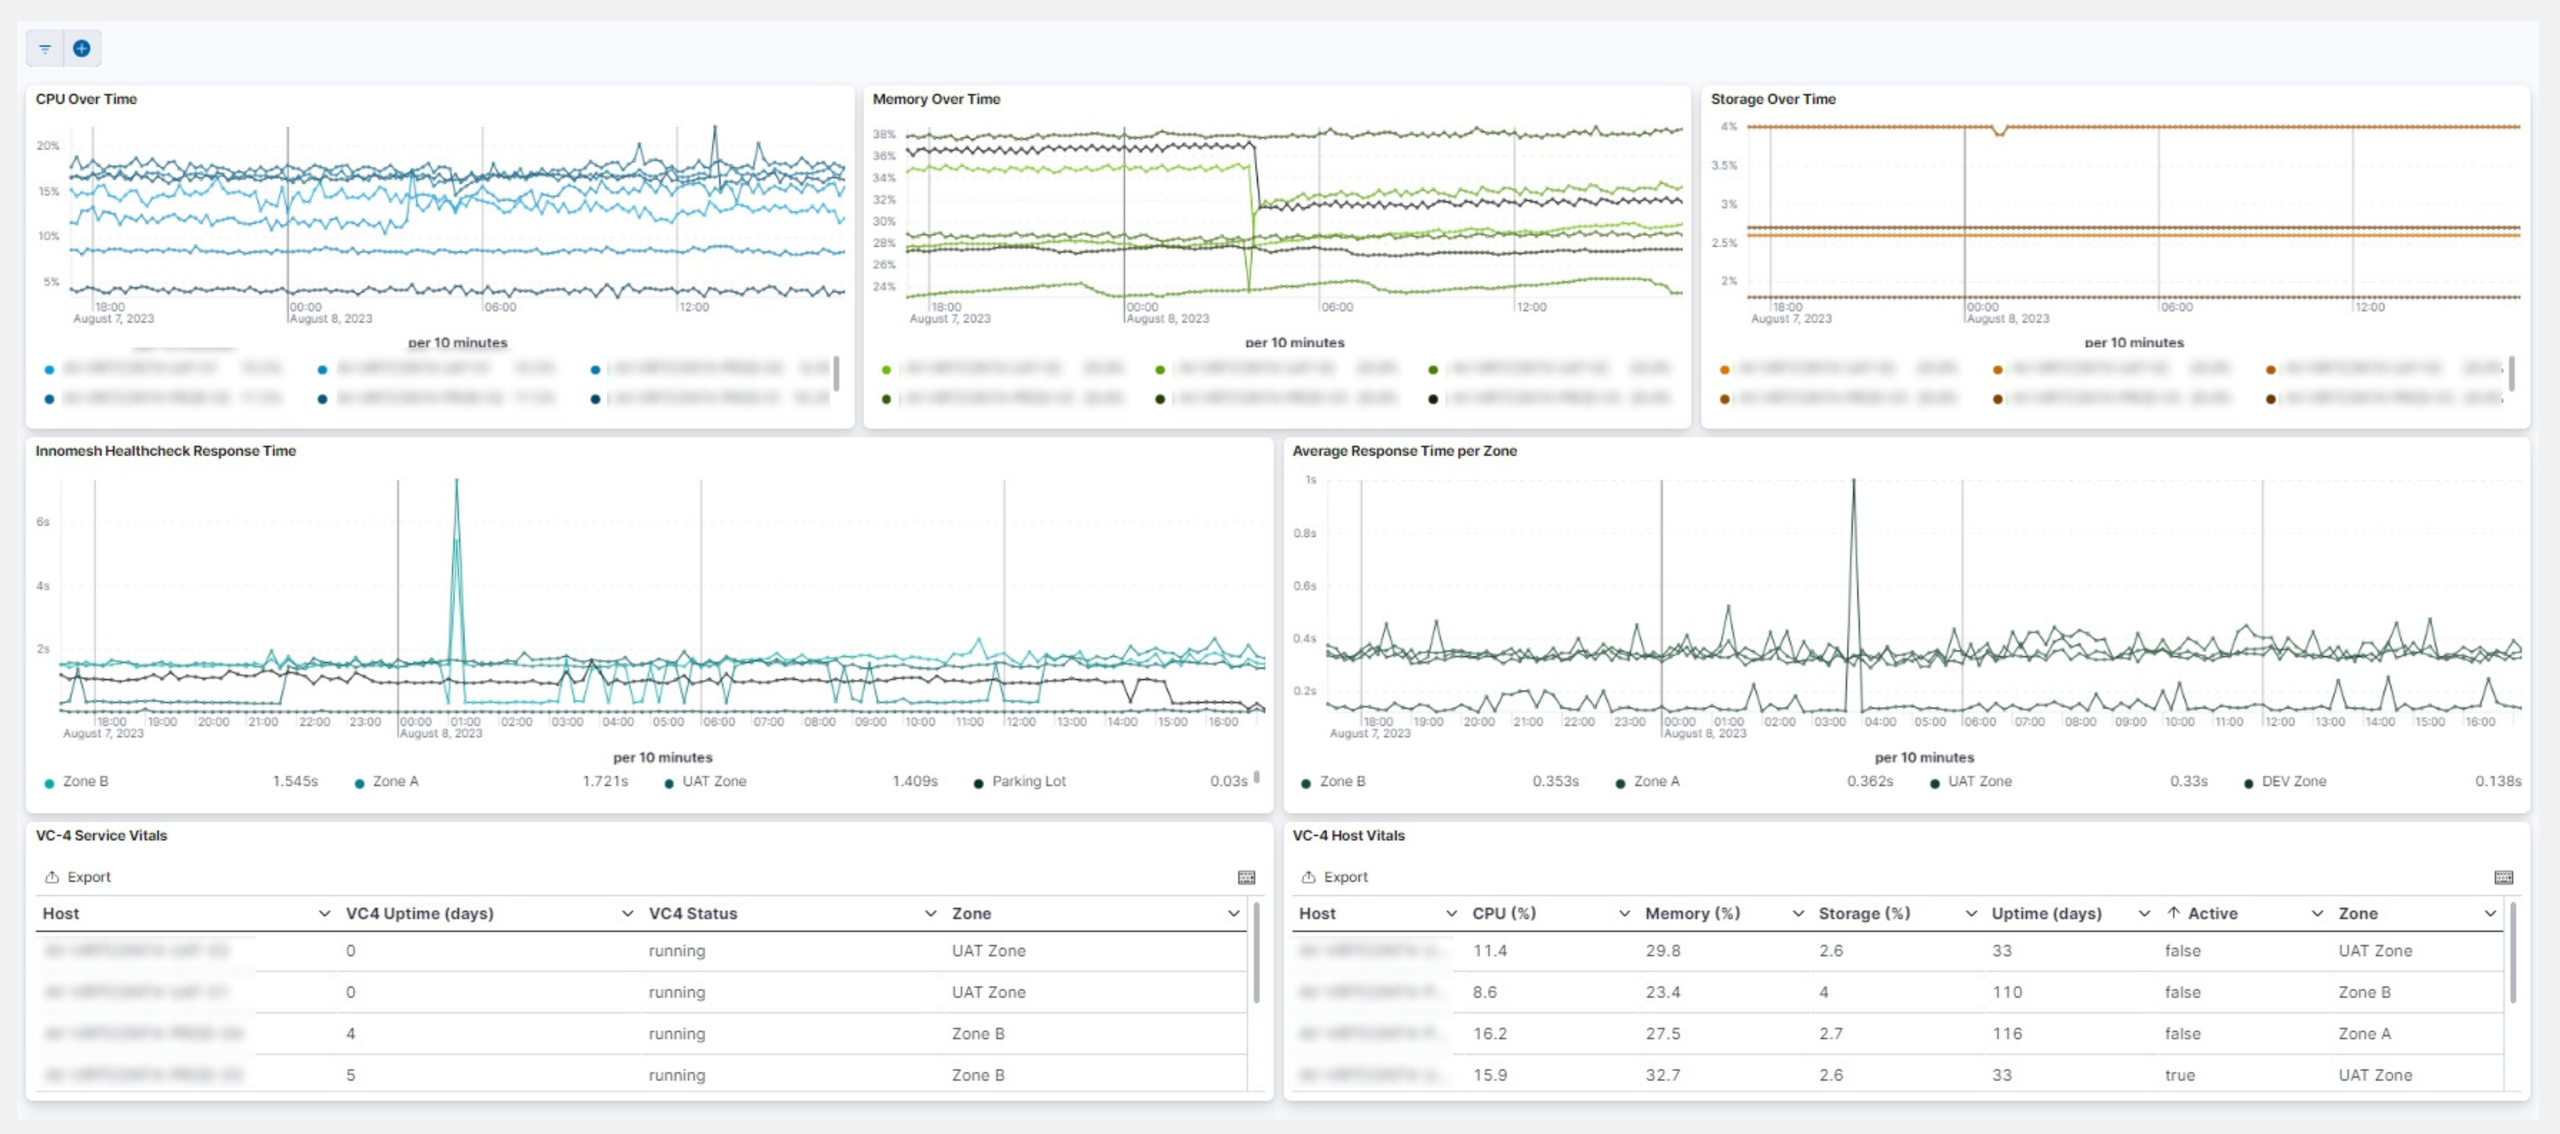
Infrastructure monitors server performance through several key metrics:
- CPU Over Time displays server CPU usage patterns.
- Memory Over Time tracks server memory consumption.
- Storage Over Time shows available storage utilisation across servers.
- Innomesh Healthcheck Response Time measures room responsiveness to detect potential problems early.
- Average Response Time per Zone identifies trends and patterns for each zone (the high-availability server cluster that runs a set of rooms).
- VC-4 Service Vitals lists all VC-4 servers with uptime, status, and zone information (exportable).
- VC-4 Host Vitals shows server active status and vital statistics.