

The Vitals page provides system performance metrics across your Innomesh environment. Each dashboard surfaces health data in near real time, enabling proactive issue detection and system optimisation.
Navigation
Open the Vitals menu from the top navigation bar. Each dashboard is a tab in the submenu below it: Infrastructure, Rooms, Network, Pulse, Sight, VNOC, and Custom. You can switch dashboards from either the top menu dropdown or the submenu tabs.
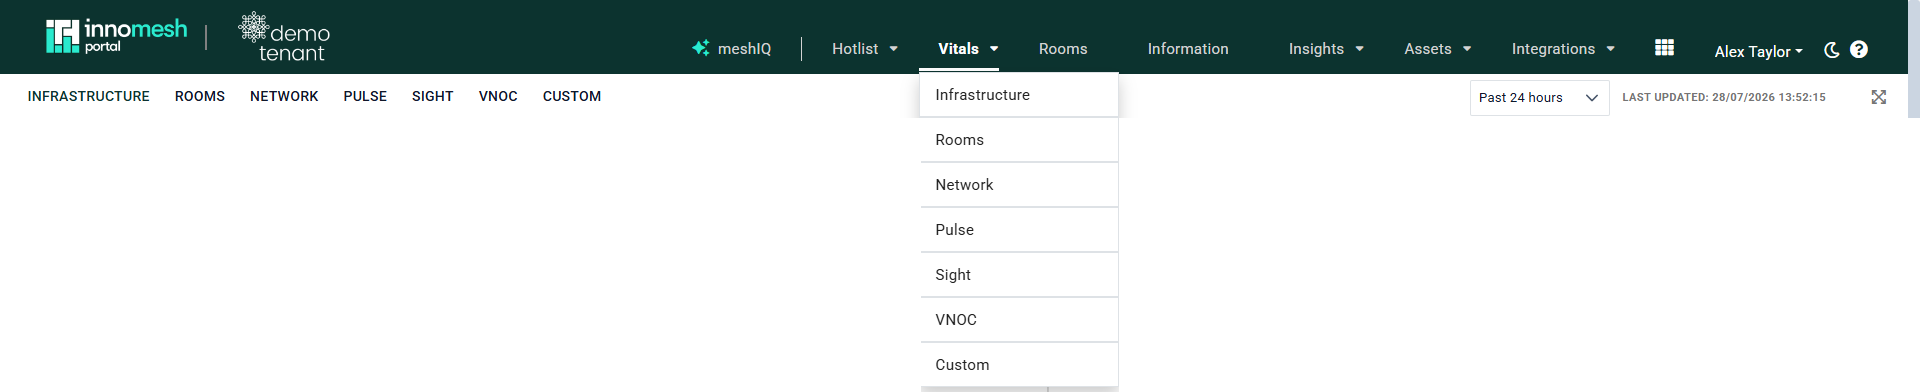
Each dashboard has a time period control in the top right. The available range is generally, though not always, between 30 minutes and 7 days, and some dashboards default to a shorter window such as the past 24 hours.
The Vitals Dashboards
Each dashboard is documented in its own article:
- Infrastructure monitors server CPU, memory, storage, and healthcheck response times.
- Rooms reports on room power, occupancy, and equipment status.
- Network tracks DNS, HTTP, TLS, transaction, and latency metrics.
- Pulse monitors devices via the IMTP protocol.
- Sight surfaces real-time device state across all rooms.
- VNOC provides visual alerts monitoring.
- Custom combines visualisations tailored to your tenancy.