

The Usage dashboard tracks source and device utilisation across your Innomesh environment. Open it from the Usage tab of the Insights page.
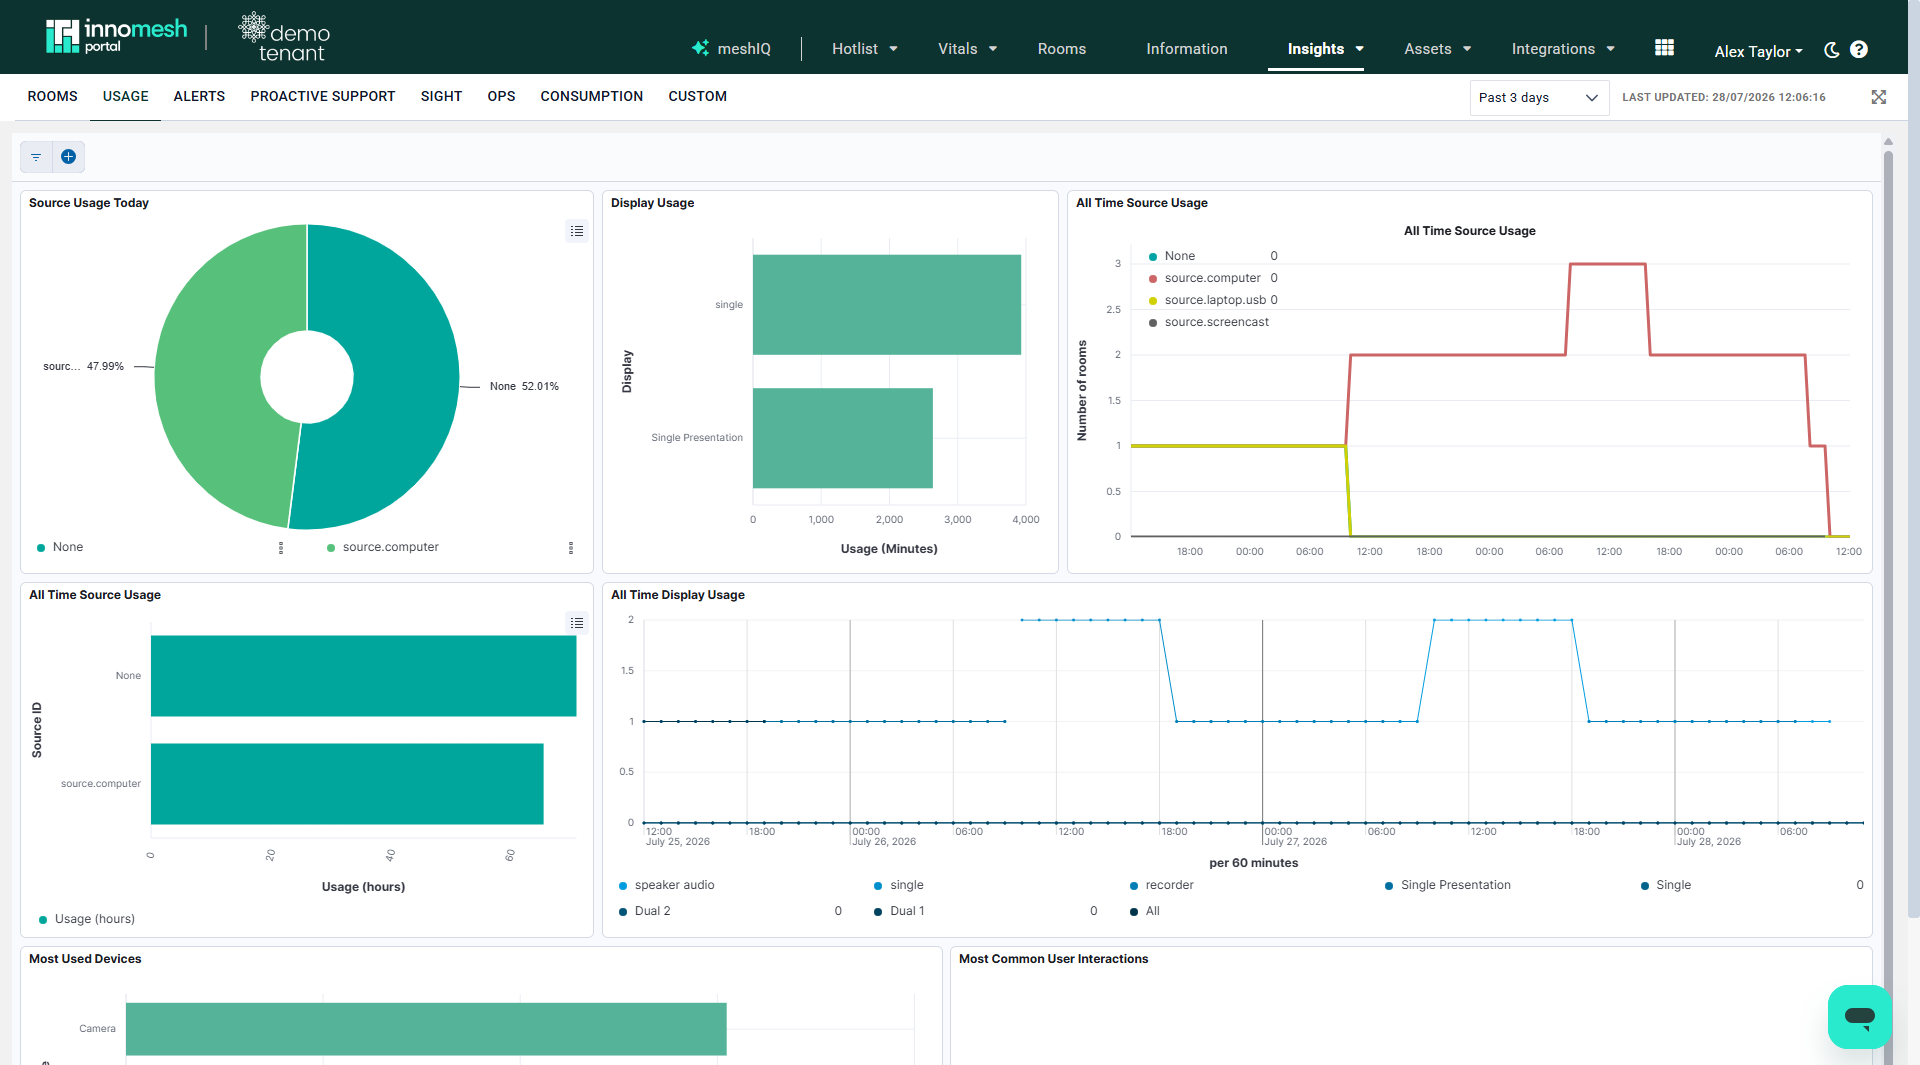
Usage tracks source and device utilisation through pie charts and bar graphs:
- Hours used per source or device type
- Simultaneous online device counts
- Most common user interactions displayed as a word cloud