Innomesh Portal is the monitoring and support side of the Innomesh platform. It provides a single-pane-of-glass view across your entire AV environment, covering real-time alerts, room status, device health, usage analytics, and centralised room information.
 Portal navigation bar | Innomesh Portal
Main Pages
Portal is organised into several pages, each accessible from the top navigation bar.
meshIQ
meshIQ is Innomesh’s platform-wide AI assistant, available in preview. Ask questions about your alerts, rooms, and wider environment in plain language, and meshIQ answers with explanations and generated charts. Open it from the meshIQ item in the navigation bar.
Hotlist
The Hotlist is the primary alert dashboard. It displays all active alerts across your environment in a single unified list, with the highest-severity alerts at the top. An Incidents tab brings together higher-order issues, such as a room outage or a wider environment outage, that may not be obvious from any single alert.
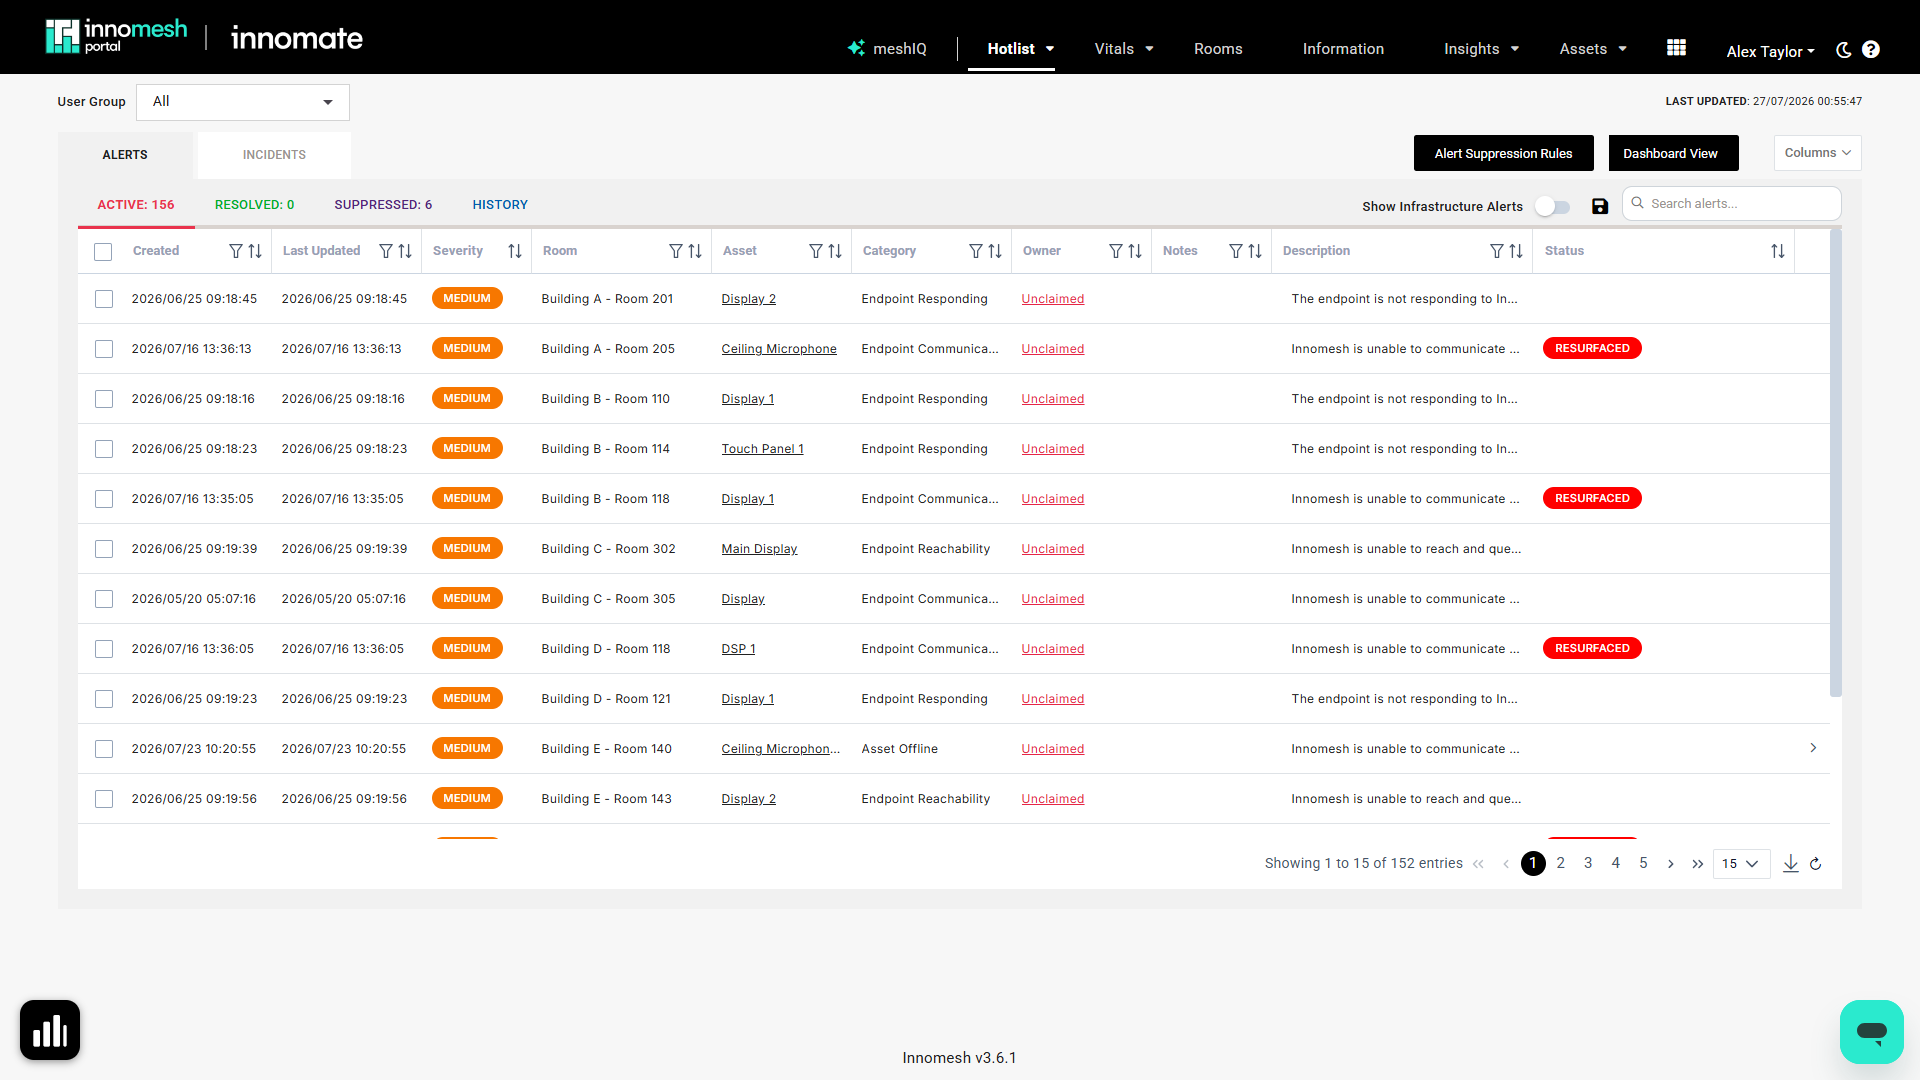
From the Hotlist you can:
- Claim alerts to indicate you’re investigating
- Assign alerts to specific users or groups
- Suppress alerts during planned maintenance
- Search and filter by room, device, severity, or category
- Show infrastructure alerts (hidden by default) whenever you need them
- View alert trends to see whether your environment is trending better or worse
Vitals
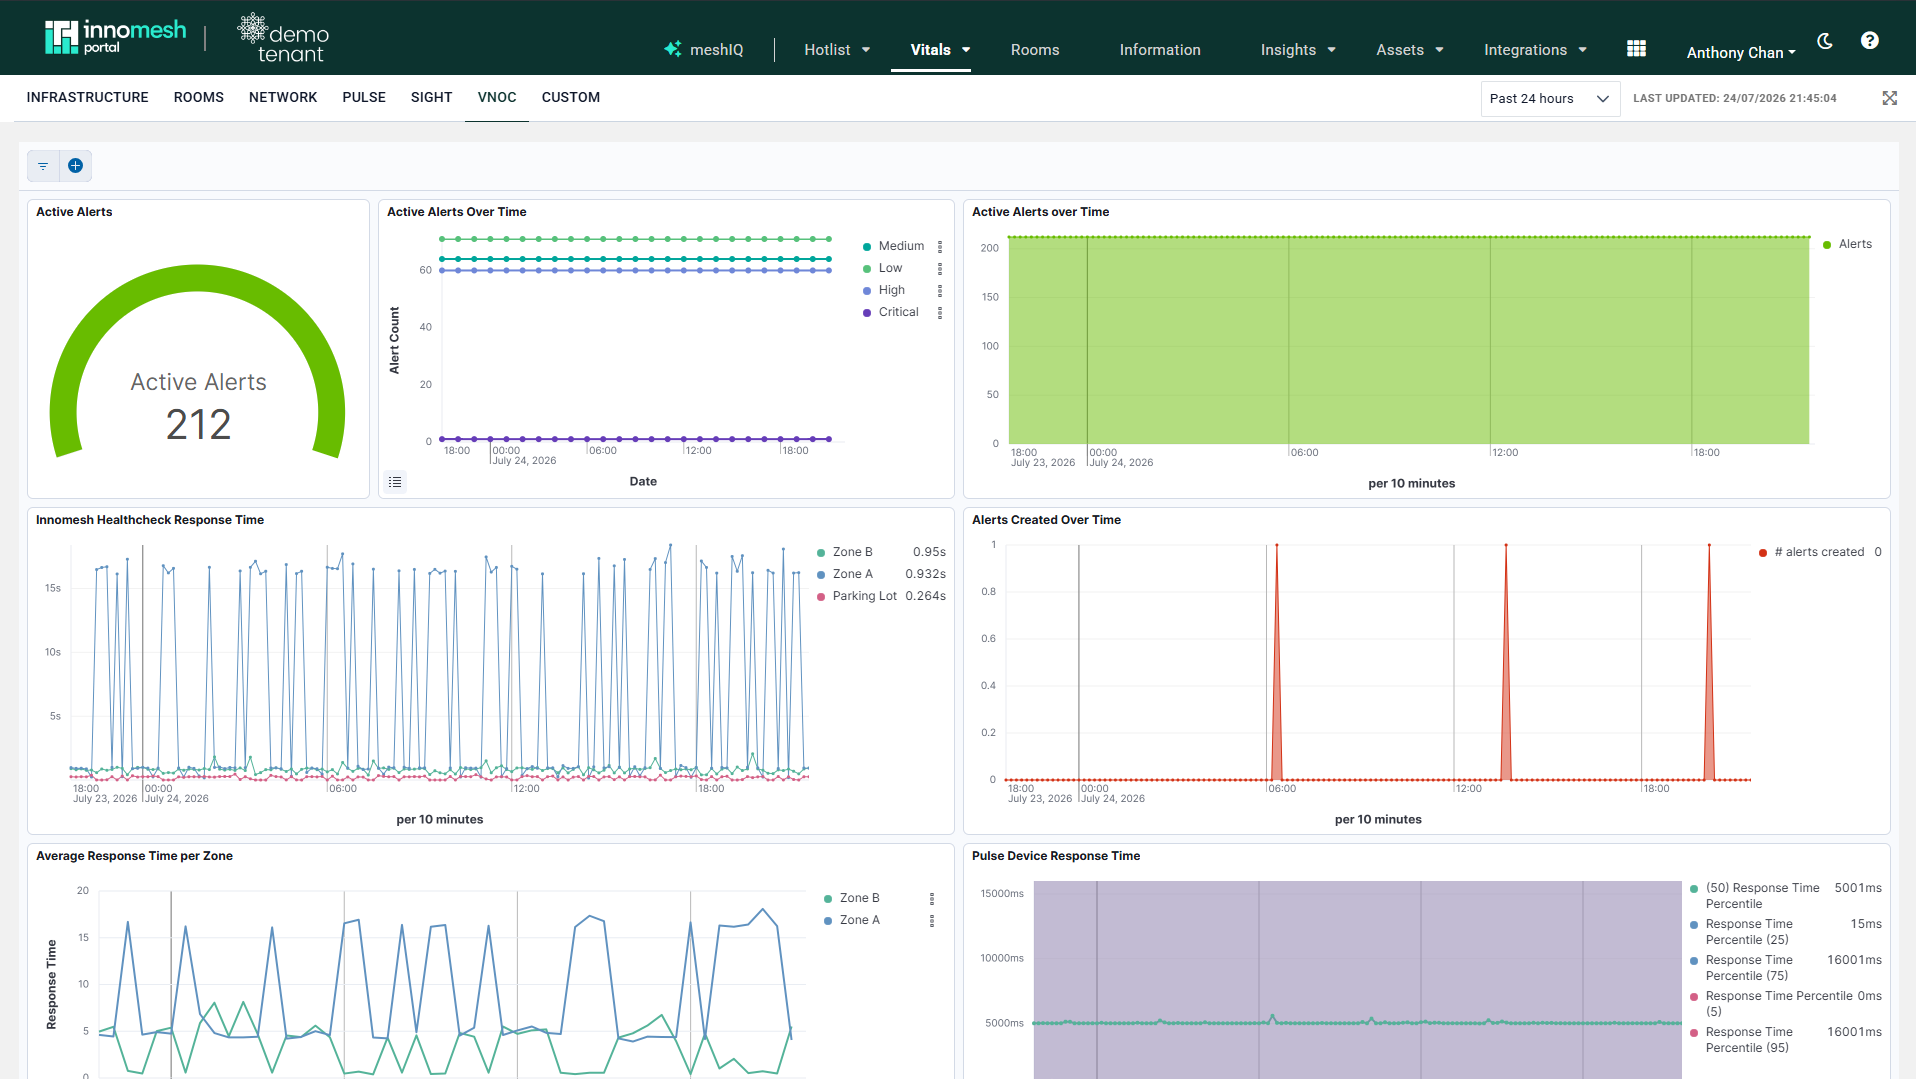
Vitals displays the health of your Innomesh infrastructure, including the servers, gateways, and edge compute hosts that power the platform. Monitor CPU, memory, storage utilisation, and health check response times over customisable time periods.
Rooms
The Rooms page lists every room in your tenancy with its current operational status (On/Off/Unknown). Click any room to open the Room Support View, which provides detailed device status, live controls, and diagnostic information.
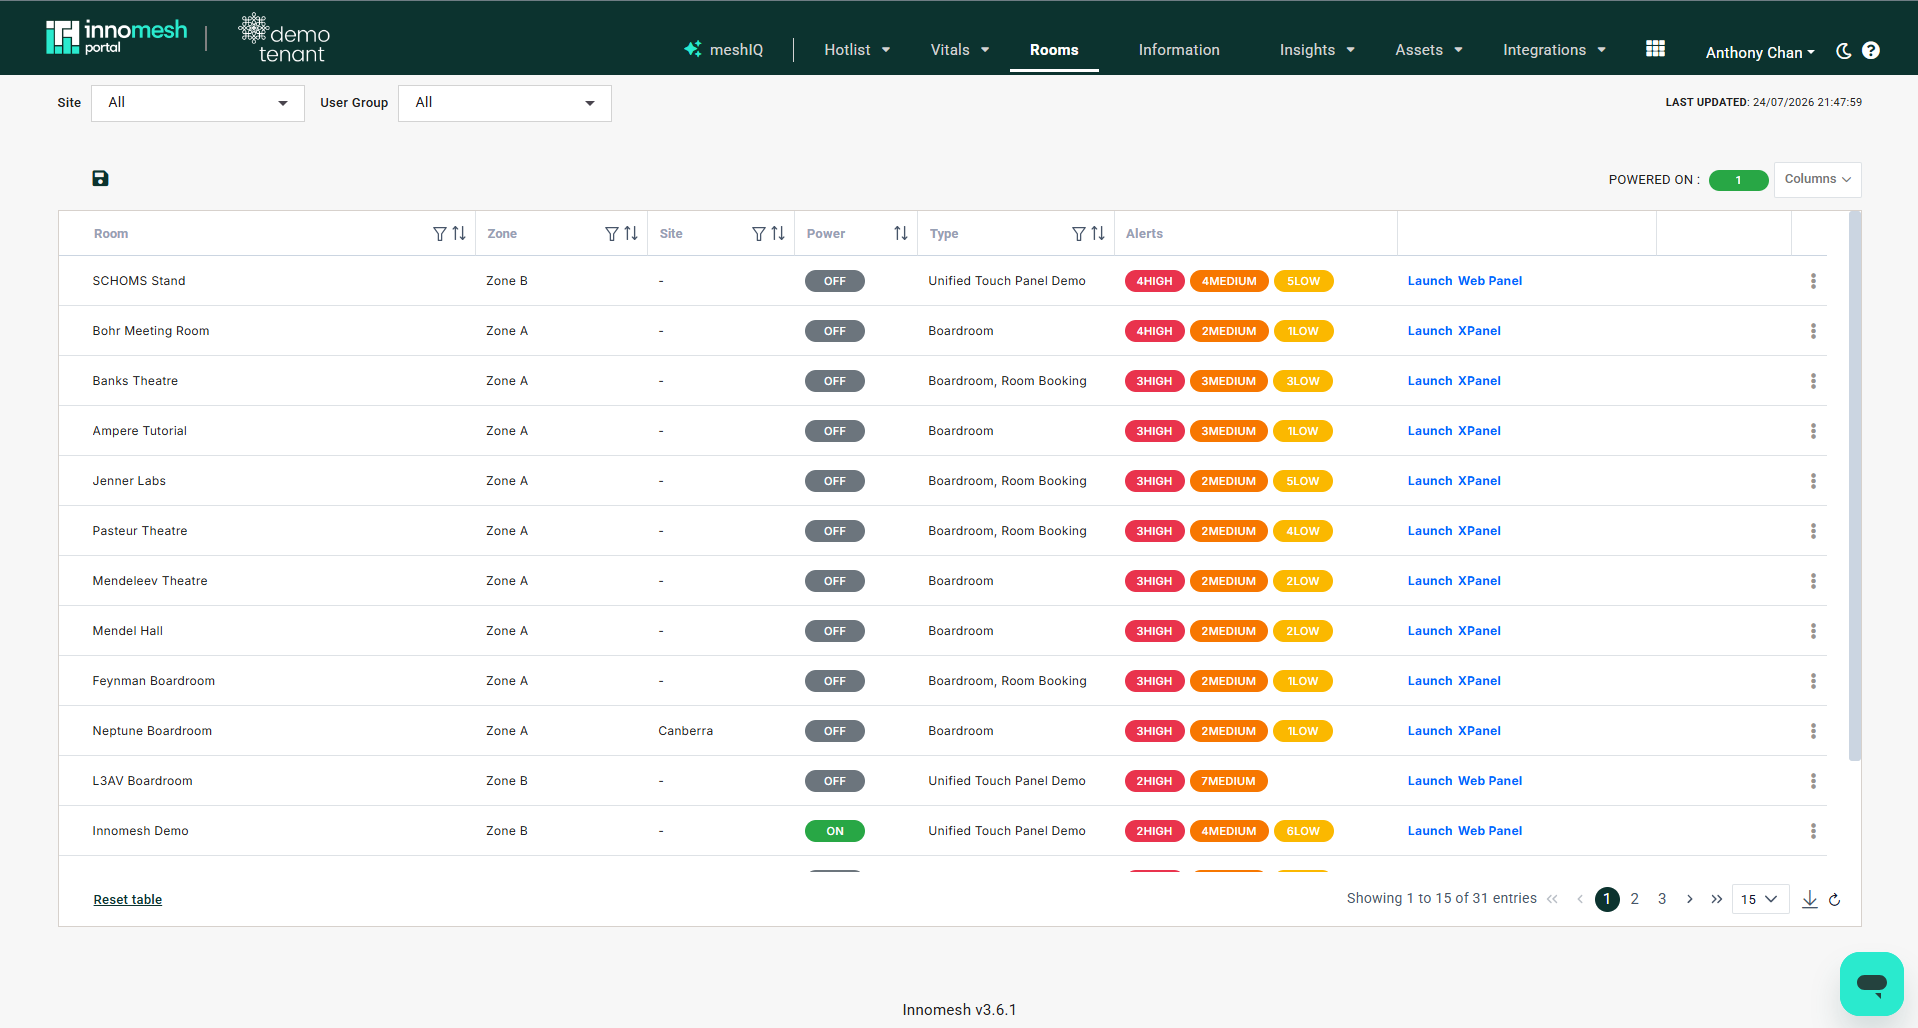
For Space VC and Space CE rooms, the Rooms page includes links to launch XPanel or web panel remote control sessions directly from the browser.
Information
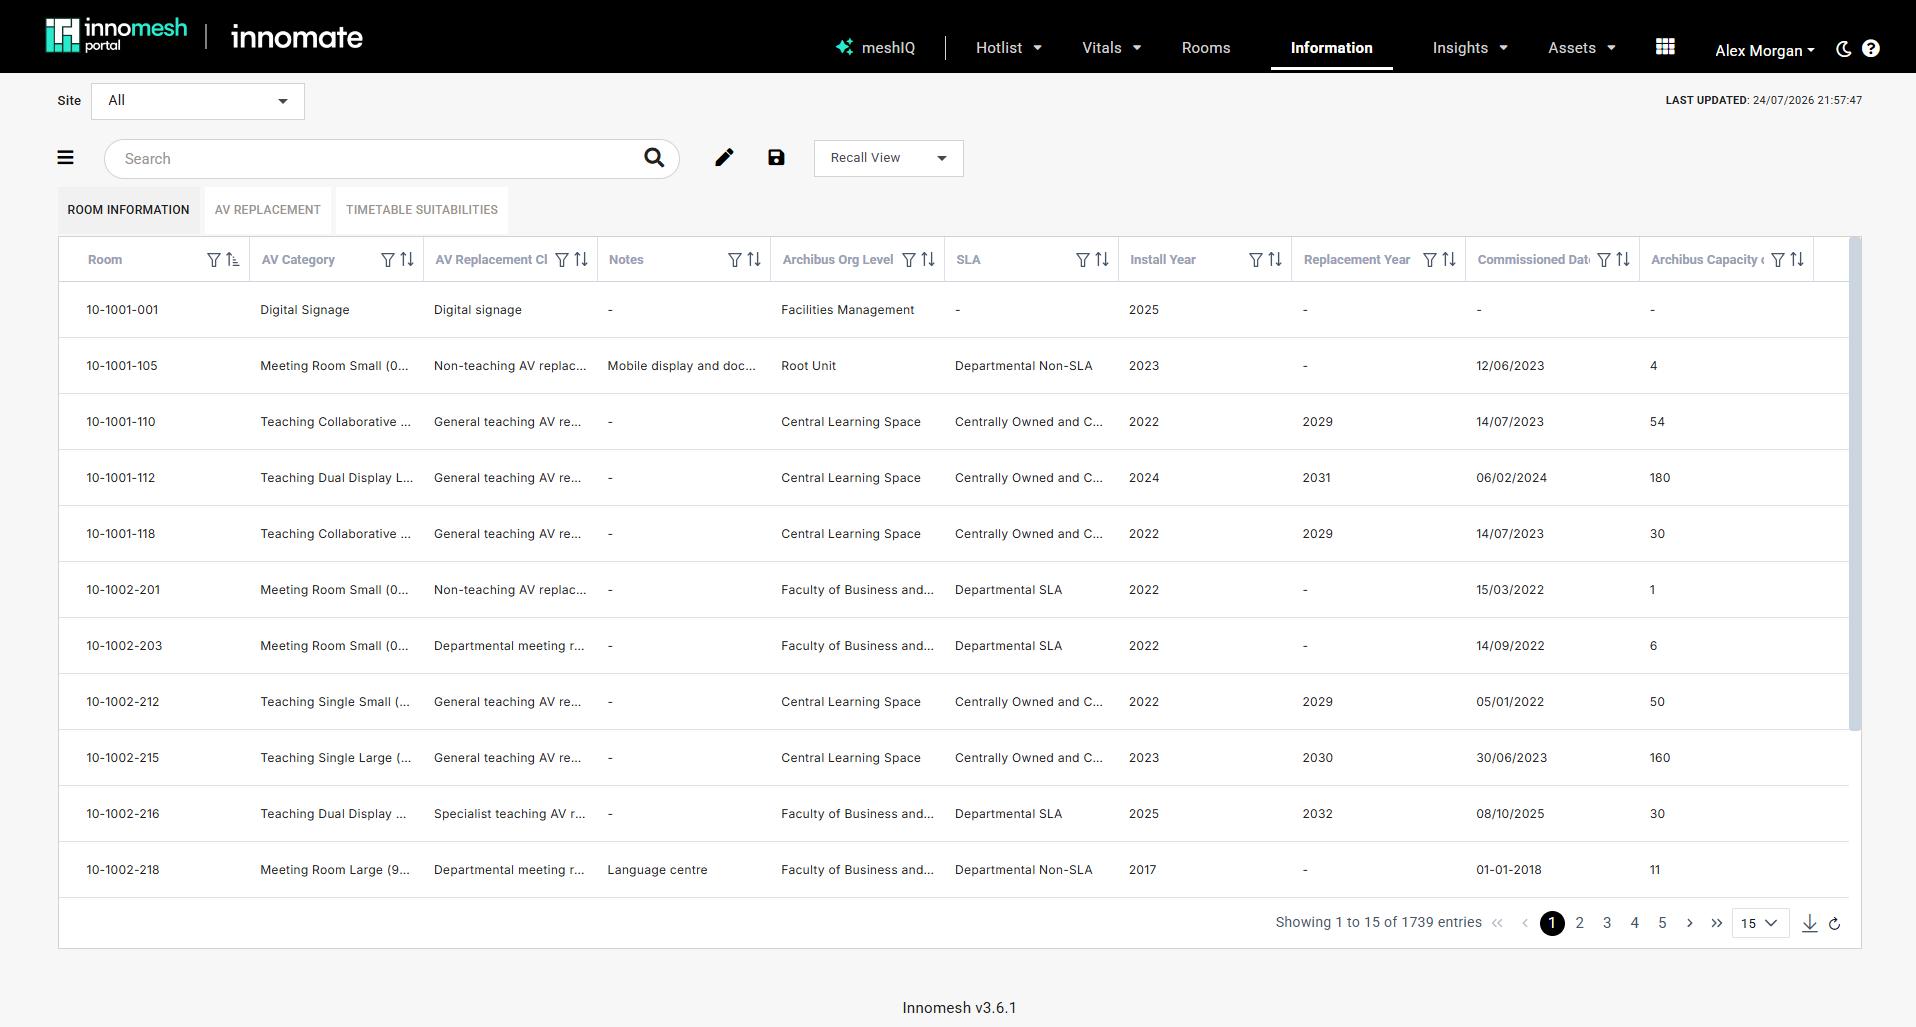
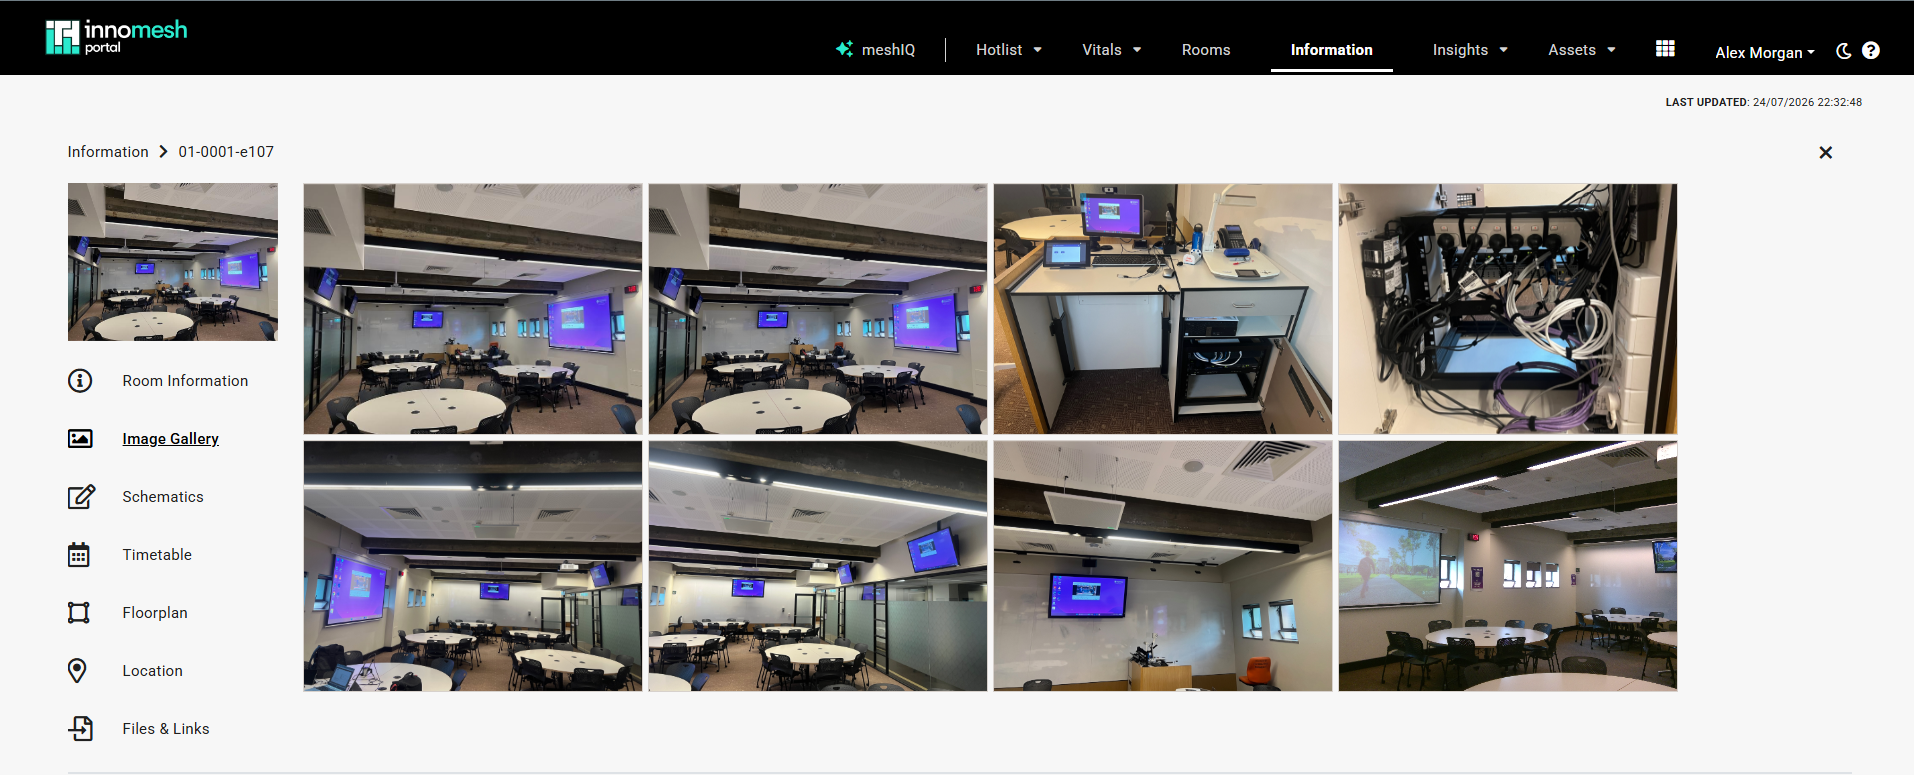
The Information page is a centralised repository for room metadata, including schematics, floor plans, timetables, photos, 360-degree views, and custom fields. It supports multiple tabs per room including Gallery, Schematics, Timetable, Floorplan, Location, Video Guide, 360 View, and Files & Links.
Insights
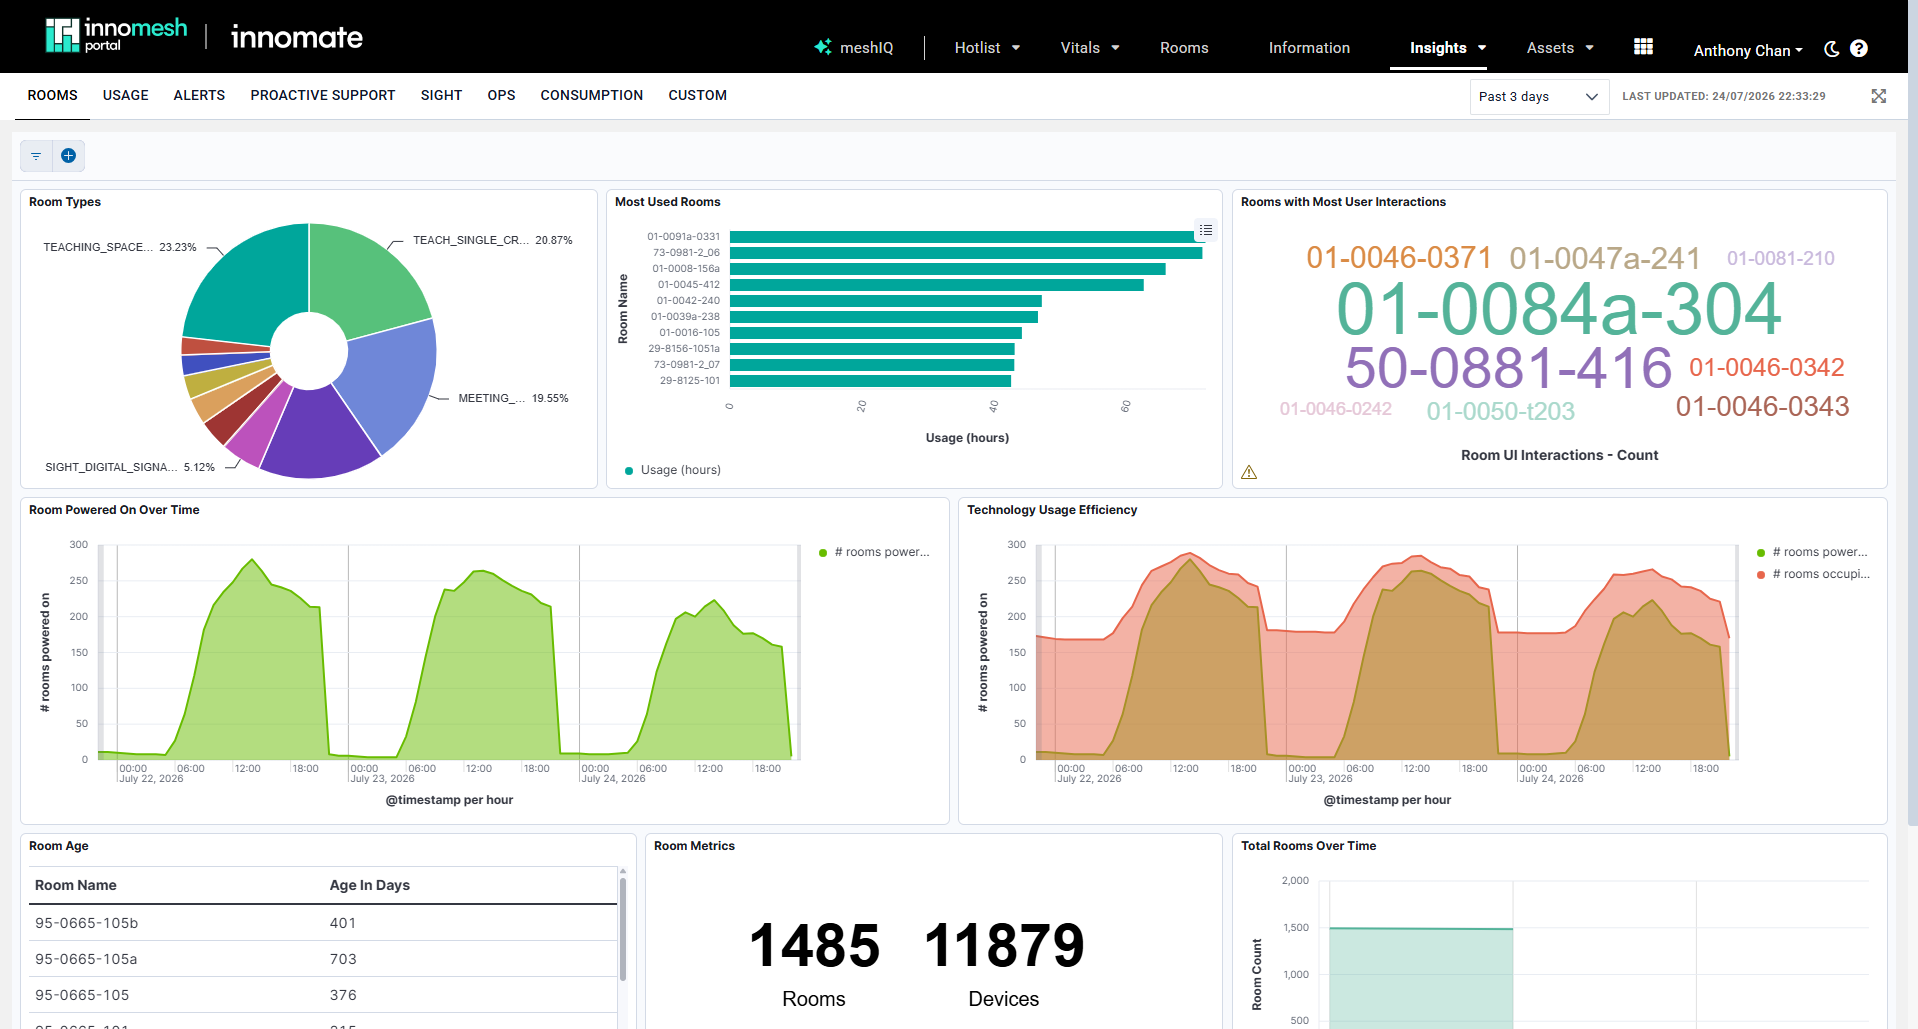
Insights provides usage analytics and trend data across your environment. Create custom graphs showing room utilisation rates, alert trends, occupancy patterns, and other metrics over configurable time periods. The Consumption dashboard gives you visibility into your subscription.
Assets
The Assets page shows every device within your Innomesh environment. Filter, sort, and search across the full device inventory. Click any asset to open the Asset Information View with detailed specifications, status, alert history, and file attachments. The Assets section is also where scheduled asset actions are shown, along with a history of the asset actions that have run.
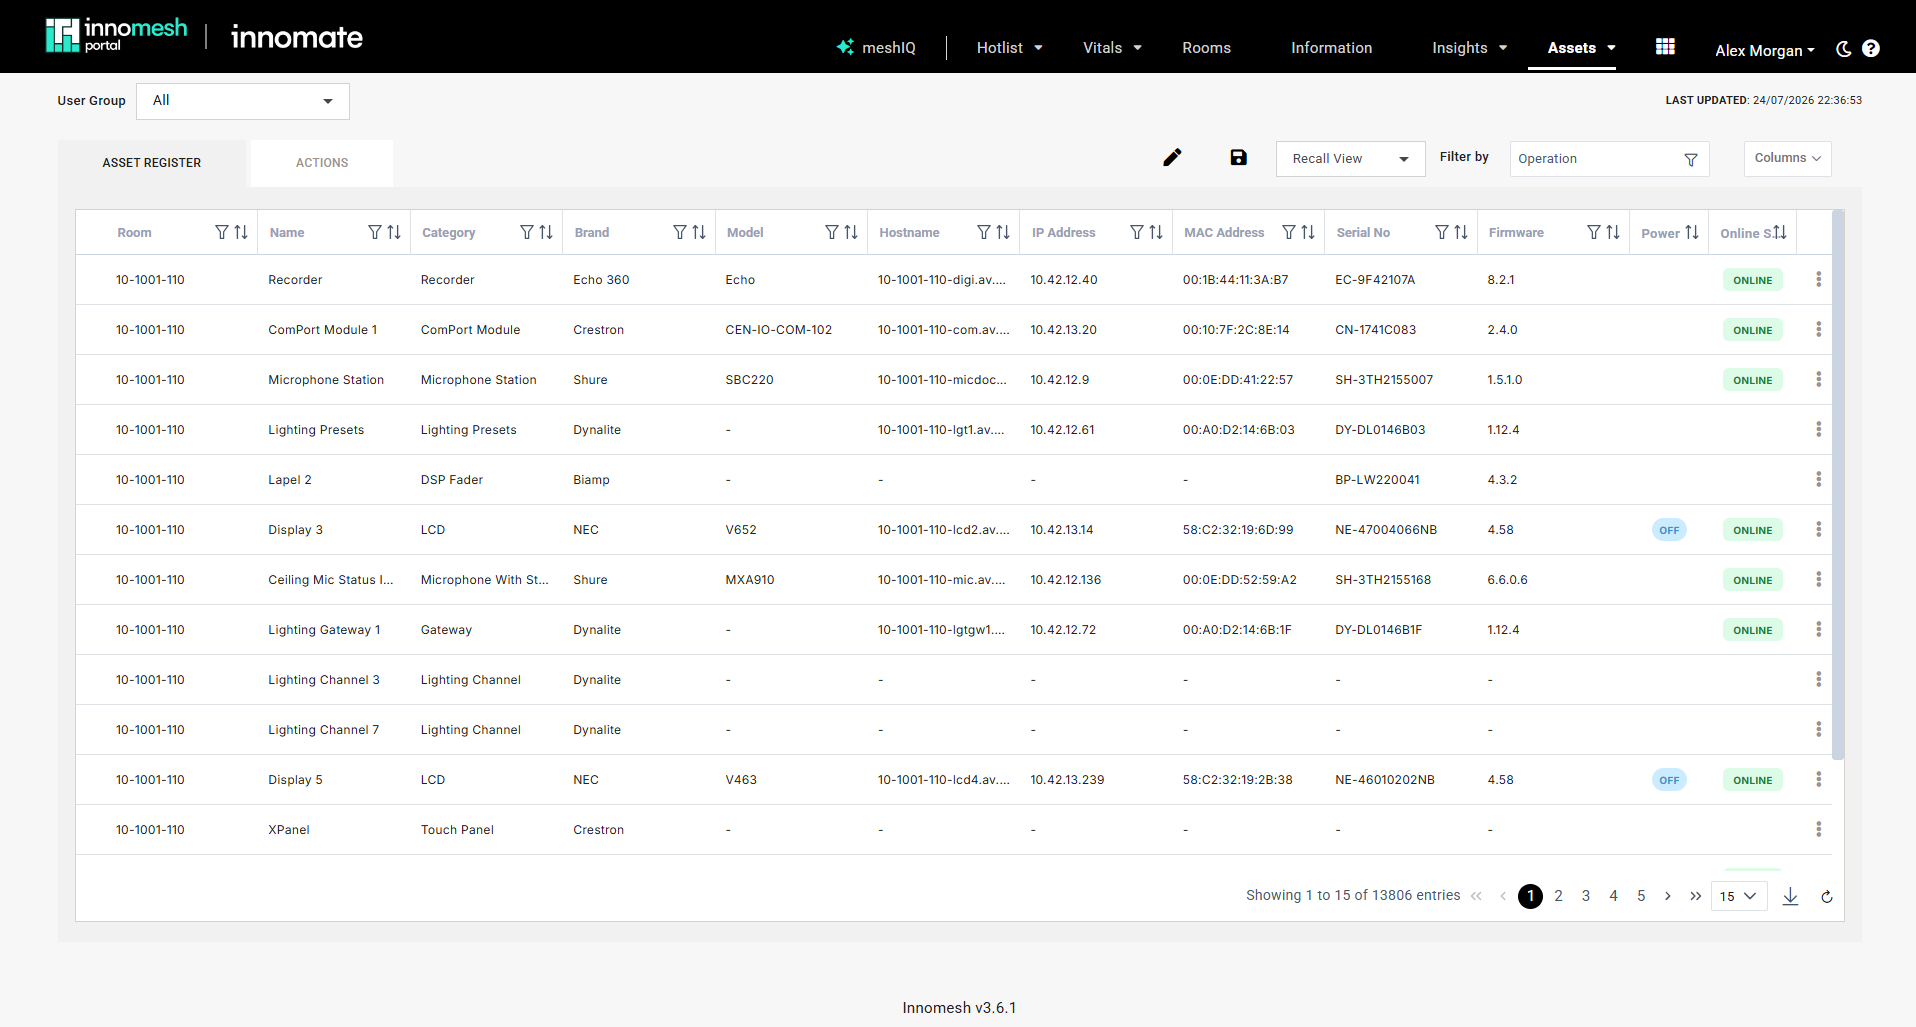
With Innomesh Ops, you can perform remote actions on assets such as rebooting devices, selecting sources, adjusting volume, and upgrading firmware across multiple devices simultaneously.
Administration
The Administration section is available to admin-role users and includes:
- User management and RBAC role configuration
- Smart Room Attributes configuration
- Room Summary Views setup
- Notification settings (Slack, Teams, Mattermost)
- Audit Logs for tracking user actions
- App Clients for API access management
Since Innomesh v3.6.1, Administration is also where asset automation policies and alert severity rules are defined, covering time-based, alert-based, and property-based automation triggers and the severity assigned to each alert category.
Logging In
The Innomesh Portal is restricted to authorised users who log in with their single sign-on (SSO) credentials. In most cases Innomesh is integrated with your organisation’s SSO, and access is governed by your Innomesh administrator.
Users are automatically logged out after a period of inactivity, typically 4 hours, though this may vary based on your organisation’s security policies.
Roles and Access Levels
Depending on your assigned roles and the access granted to those roles, you may see only a subset of the pages and menu items described above. For example, a user whose roles do not include Vitals or Insights access will not see those items in the navigation bar.
The roles below are the defaults, and can be customised to suit your organisation as required.
| Role | Access |
|---|---|
| Innoportal_admin | Full access to all pages including Vitals, Insights, and Administration |
| Innoportal_user | Hotlist, Rooms, Information, and Assets only |
Access is controlled via RBAC roles. See RBAC Authorisation Guide for details.